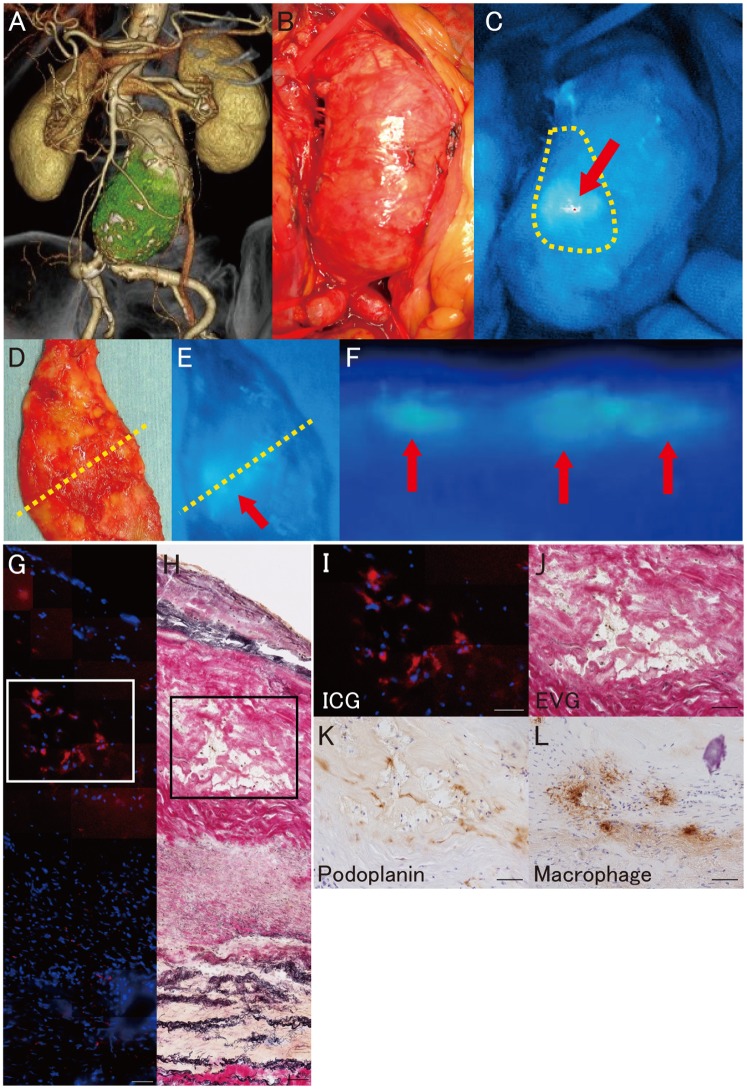
Figure 5. Fluorescence lymphography and microscopy of abdominal aortic aneurysm.
A, Three dimensional CT image of an infrarenal abdominal aortic aneurysm (AAA). B, Intraoperative photography of an infrarenal AAA. C, Intraoperative near-infrared fluorescence lymphography of indocyanine green (ICG) (red arrow: ICG fluorescence, yellow dotted-line: sample resection line). D, Macroscopic findings of the resected sample observed from the luminal side (yellow dotted line: cross-section line of the harvested sample). E, Near-infrared fluorescence lymphography of ICG in the resected aneurysmal wall observed from the luminal side (red arrow: ICG fluorescence, yellow dotted line: cross-section line of the harvested sample). F, Near-infrared fluorescence lymphography of ICG in the cross-sectioned AAA wall (red arrow: ICG fluorescence, up: luminal side, bottom: adventitial side). G, Fluorescence microscopy of ICG in the AAA wall (ICG: red, DAPI: blue). H, Serial frozen section with Elastica van Gieson staining. I, Higher magnification of the outlined area in G. J, Higher magnification of the outlined area in H. K, Immunohistochemistry for podoplanin in the outlined area in G and H. L, Immunohistochemistry to label macrophages in the outlined area in G and H. Scale bars indicate 50 µm (G–L).

