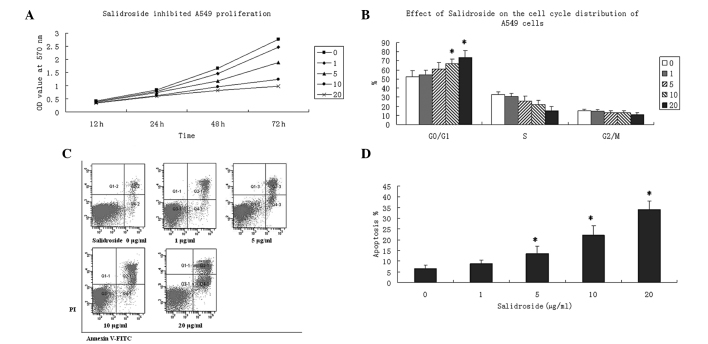
Figure 1.
Effect of salidroside on the cell viability of A549 cells. (A) Cells were seeded onto 96-well culture plates and incubated with various concentrations of salidroside (0, 1, 5, 10 and 20 μg/ml) for 24 h. Cell proliferation was detected by MTT assay. Data are presented as the OD values at 570 nm wavelength and were obtained from at least three independent experiments. (B) Cells were seeded and incubated with various concentrations of salidroside (0, 1, 5, 10 and 20 μg/ml) for 24 h. PI (20 μg/ml) staining was performed to determine the percentages of cells in the G0/G1, S and G2/M phases. (C) Cell apoptosis was determined using Annexin V-FITC and PI double-staining. Salidroside treatment increased the apoptotic rate in A549 cells in a concentration-dependent manner. Images from three experiments are shown. (D) Apoptotic rates were analyzed in A549 cells treated with various concentrations of salidroside (0, 1, 5, 10 and 20 μg/ml) for 24 h. Annexin V+/PI− and Annexin V+/PI+ populations were considered as apoptotic cells. Data are presented as the mean ± SD and were compared using a two-tailed, unpaired t-test. *P<0.05, vs. the control group. PI, propidium iodide; FITC, fluorescein isothiocyanate; MTT, 3-(4,5-dimethylthiazol-2-yl)-2,5-diphenyltetrazolium bromide.

