
Figure 3.
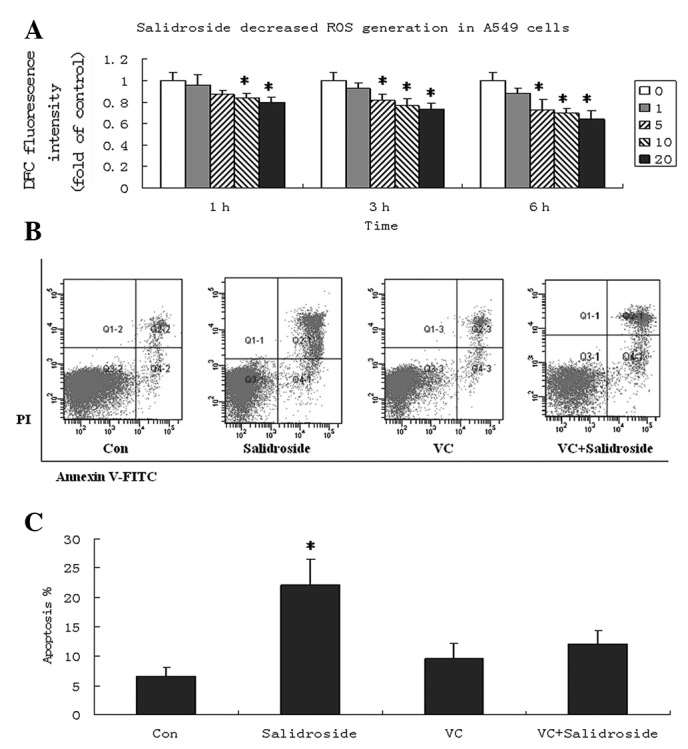
Salidroside decreases intracellular ROS in A549 cells. (A) Cells were treated with various concentrations of salidroside (0, 1, 5, 10 and 20 μg/ml) for 1, 3 and 6 h, followed by a 30-min incubation with 2′,7′-dichlorodihydrofluorescein diacetate at 37˚C for ROS detection. Data are presented as the fold increase compared with that of the control cells, and graphs present the mean ± SD. (B) VC pretreatment decreased the apoptosis of A540 cells induced by salidroside. VC (100 μM) was applied to A549 cells for 1 h. Subsequently, A549 cells were treated with salidroside (10 μg/ml) for 24 h and apoptosis was determined by Annexin V-FITC and PI double-staining. Images from three experiments are shown. (C) Apoptotic rates were analyzed in A549 cells. Annexin V+/PI− and Annexin V+/PI+ populations were considered to be apoptotic cells. Data are presented as the mean ± SD and were compared using a two-tailed, unpaired t-test. *P<0.05, vs. the control group. ROS, reactive oxygen species; VC, vitamin C; PI, propidium iodide; FITC, fluorescein isothiocyanate.