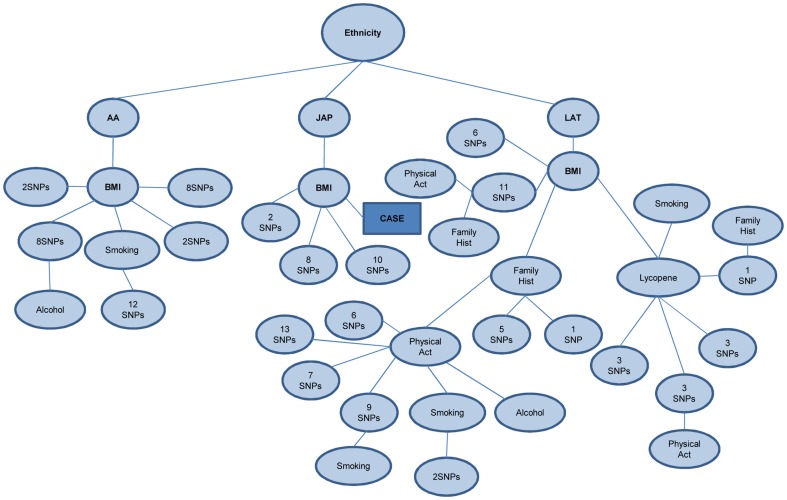
Figure 2. Overall tree structure of the hybrid model.
The main tree is given in the Tree S1 material because the structure is too big. This figure is a small representation of main tree. Decision starts with ethnicity and African Americans are represented by AA, Japanese by JAP and Latinos by LAT. For all ethnicities the most descriptive phenotypic attribute is body mass index (BMI). Other phenotypic attributes that are in upper levels of tree are smoking behavior, family history, lycopene intake and physical activity. The number of SNPs in the nodes indicates the total number of SNPs found in different levels on that particular path of the tree.

