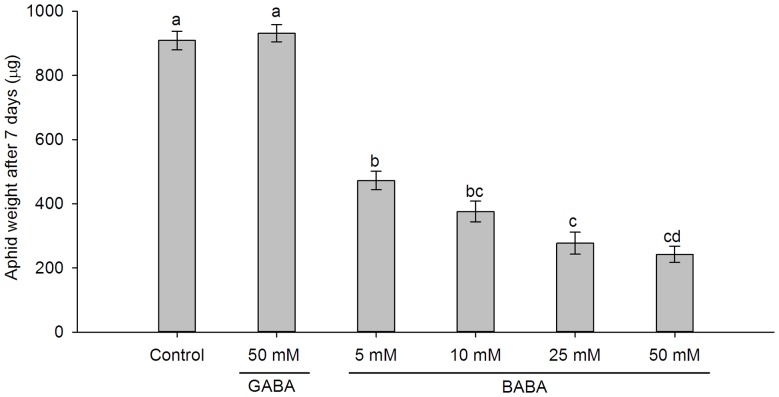
Figure 1. Sitobion avenae weights after feeding for 7 days on wheat seedlings with different treatments.
Aphid weights on wheat plants soil-drenched with MilliQ water (control), 50 mM GABA, different concentrations of BABA. Bars represent mean ± SEM. Different letters above bars indicate statistically significant differences (P<0.05, Turkey's HSD test).

