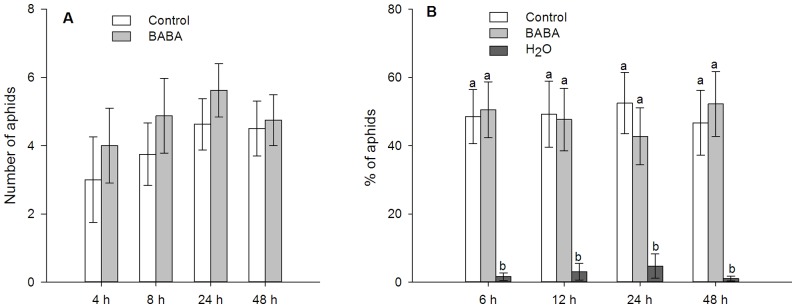
Figure 2. Settling preference of Sitobion avenae.

(A) Mean number (± SEM) of S. avenae settling on control or BABA-treated plants (n = 8, paired t-test). Plants were soil-drenched with MilliQ water (control) or 25 mM BABA. (B) Percentage of S. avenae feeding on MilliQ water (H2O), standard artificial diet (control) and artificial diet containing 50 mM BABA (BABA). Shown are mean ± SEM (n = 14). Different letters indicate statistically significant differences (P<0.05, Turkey's HSD test).
