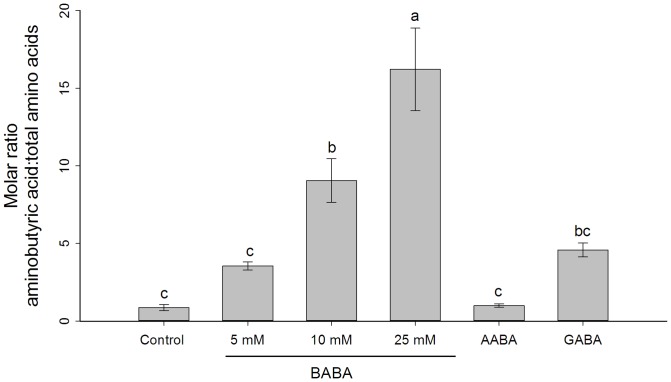
Figure 3. Relative aminobutyric acid levels in phloem sap of wheat seedlings.
Plants were soil-drenched with different concentrations of BABA, 50 mM AABA and 50 mM GABA. Phloem sap was collected 3 days after treatment. Shown are mean ± SEM (n = 6). Different letters indicate statistically significant differences (P<0.05, Turkey's HSD test).

