
Figure 2. Mean α exponent (DFA) of inter-beat intervals (white triangles) and inter-stride intervals (squares) in Experiment 1.
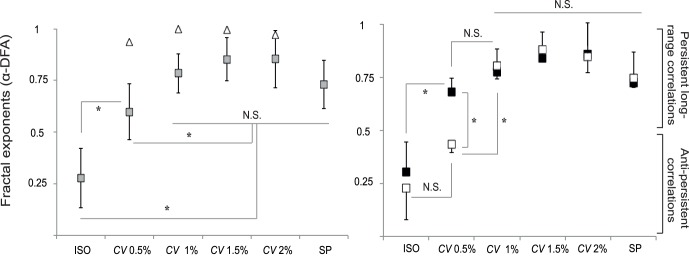
(*: p<0.05; N.S.: non-significant differences; error bars: standard deviation). Left panel: The evolution of α for all participants taken together (n = 12) could be interpreted as a progressive increase with increasing CV. Right panel: Qualitatively different changes in α exhibited by two subgroups: group 1 (black squares, n = 8) shows an abrupt switch from anti-persistent to persistent long-range correlations at CV = 0.5%, while group 2 (white squares, n = 4) switches at CV = 1%.