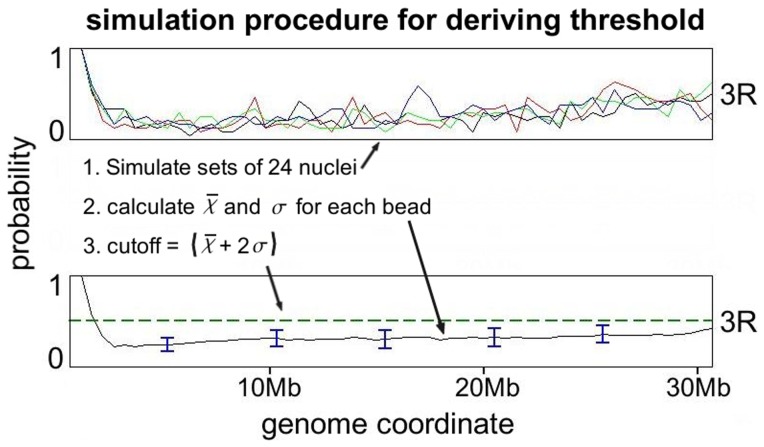
Figure 5. Procedure for deriving statistically significant threshold for identifying Chr – NE contacts in chromosomes tracing experiments (only chromosome 3R is shown for clarity).
96 sets of 24 nuclei were simulated (without enforcement of Chr-NE contacts). NE contact frequency for each chromosome position is plotted as a “contact frequency profile”; profiles from 4 independent simulations are exemplified in the top panel. The mean ( ) contact frequency and the standard deviation obtained from these simulated tracing experiments are used to set a threshold for identifying statistically significant Chr-NE contacts (
 ) and anti-contacts (
 ).
).

