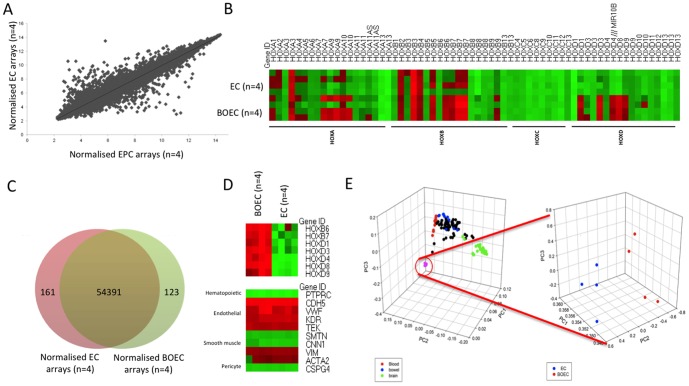
Figure 2. BOECs have a near identical mRNA microarray profile to PAECs but differ significantly in HOX expression.
a) Microarray expression of BOECs vs PAECs (n = 4) demonstrates high concordance of gene expression b) Heat map of HOX genes in BOECs vs PAECs. c) Venn diagram showing convergence of gene expression, d) Heat maps of differentially expressed HOXs. Additional lineage associated transcripts showing endothelial expression pattern, e) PCA analysis of BOEC vs 131 tissue arrays. Principal components analysis; Graph 1-blood derived cells (red), bowel (blue), brain (green); Graph 2 PAECs (blue), BOECs (red) demonstrating similarity of BOECs and PAECs when compared to other mature cell types.

