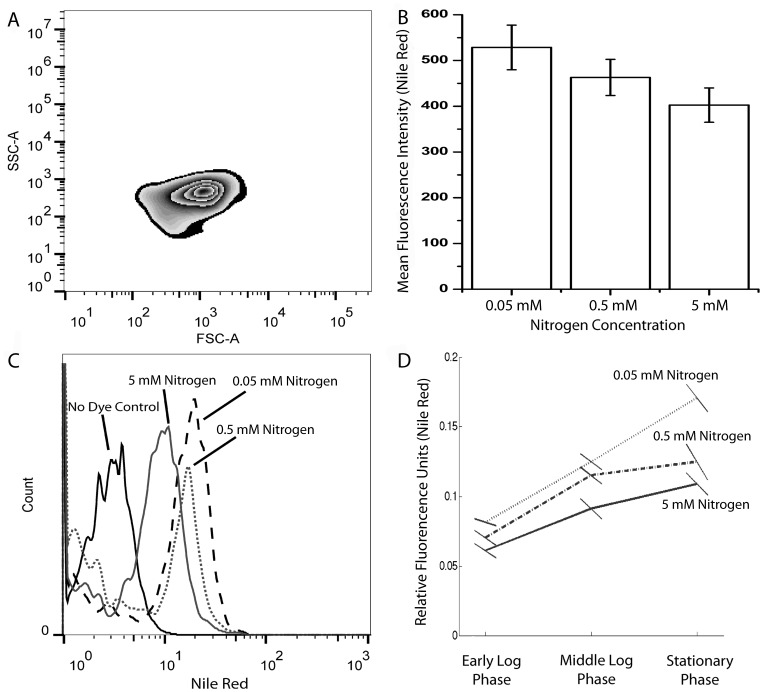
Figure 3. Lipid content analysis of Dunaliella salina strain Tuz_KS_01 under different nitrogen conditions.
A) Zebra-plot of SSC (Side Scatter) and FSC (Forward Scatter) expressing cellular granulation and cellular size, respectively, under a representative nitrogen depletion condition (0.05 mM). B) A representative histogram of flow-cytometric analysis of lipid contents under different nitrogen concentrations C) Mean fluorescent intensities (MFI) of flow cytometric analysis. D) Fluorometric microplate Nile Red analysis of early logarithmic, late logarithmic and stationary growth phases. Data represent the mean values of triplicates. Standard error for each triplicate is shown as tilted lines for clarity, where the minimum and maximum y values of each line corresponds to ±1 SE.

