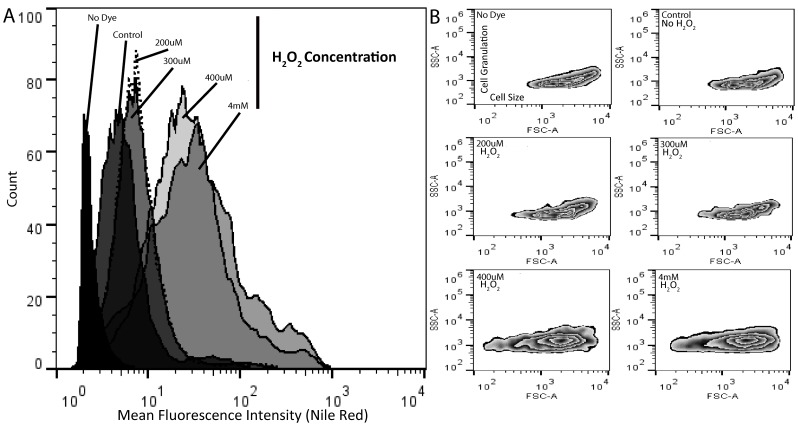
Figure 10. Flow cytometric Nile red, cellular granulation and biovolume analysis of Chlamydomonas reinhardtii cells cultivated under different H2O2 concentrations.
A) A representative histogram of flow-cytometric analysis of lipid contents under different H2O2 concentrations. B) Zebra-plot of SSC (Side Scatter) and FSC (Forward Scatter) expressing cellular granulation and cellular size, respectively, under different H2O2 concentrations. Data represent the mean values of triplicates ±1 SE.

