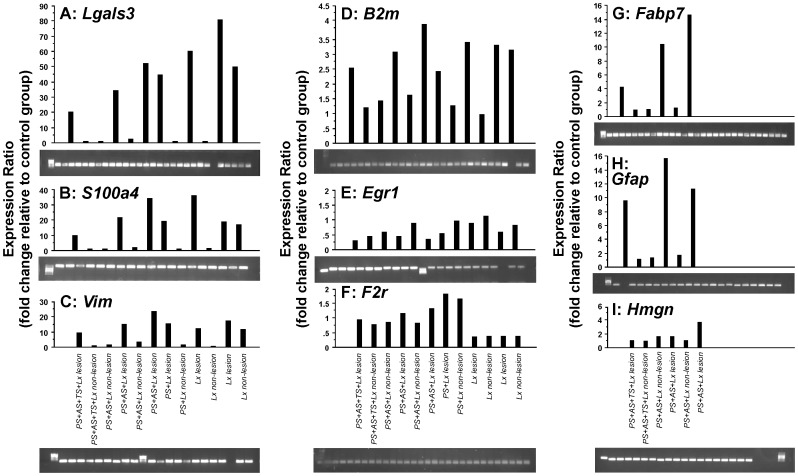
Figure 6. Global gene expression analysis by microarrays was validated by RT-PCR analysis of selected genes.
A, Lgals3; B, S100a4; C, Vim; D, B2m; E, Egr1; F, F2r; G, Fabp7; H, Gfap; I, Hmgn. All measurements were compared to naïve controls values. Gadph was used as a reference control for calculation of gene expression ratio. PCR-product amplification was confirmed by agarose electrophoresis gels (photographs).

