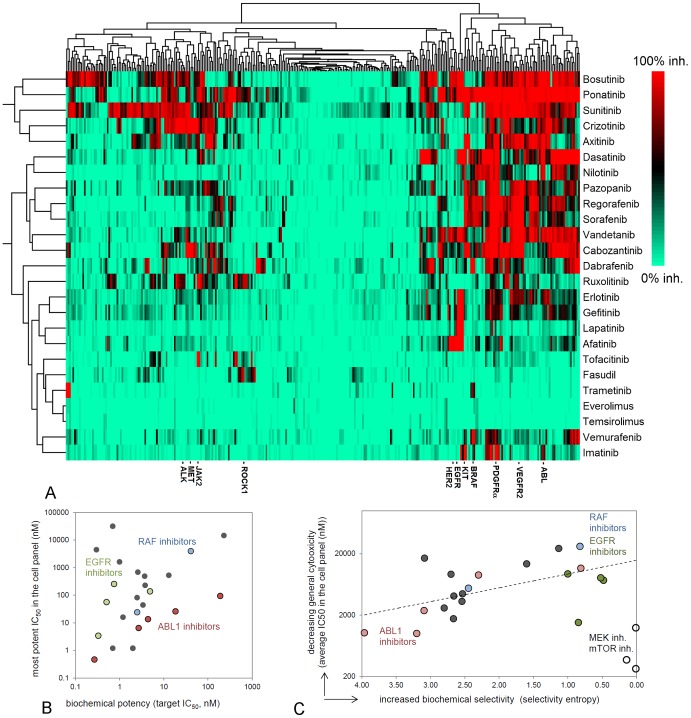
Figure 3. Biochemical profiling of marketed kinase inhibitors.
A: Hierarchical clustering of inhibitory profiles of all kinase drugs in a panel of more than 300 biochemical kinase assays (%-inhibition at 1 μM inhibitor concentration). Trametinib, everolimus and temsirolimus show only minor inhibition, as mTOR and MEK kinase assays are not included in the panel. B: Potent biochemical IC50s on the biological target correlate with more potent cellular IC50s. C: Biochemical selectivity leads to a more selective response in the cell panel. Biochemical selectivity was quantified by selectivity entropy [33] and the selectivity of targeting cell growth was expressed by the average IC50 in the cell panel. Non-oncology drugs fasudil and tofacitinib were deleted from the analysis because of lack of response. Open circles: the mTOR and MEK inhibitors everolimus, temsirolimus and trametinib, respectively.

