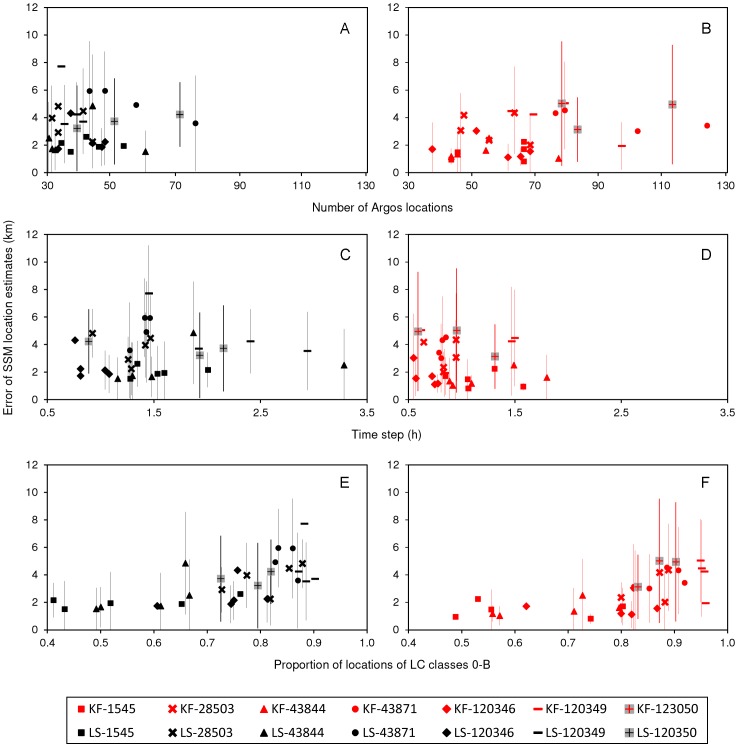
Figure 3. Trip-averaged error in locations estimated from LS and KF models relative to Argos data quality.
Relationship between mean errors (±SD shown as vertical bars) in locations estimated from state-space models fit to Least Squares (LS) (black) and Kalman filtered (KF) (red) data per harbour seal trip and quality of Argos telemetry data used to fit the models: A–B. Number of locations. C–D. Time step (h) between locations. E–F. Proportion of locations of LC 0-B. Different trips from the same seal have the same symbol.

