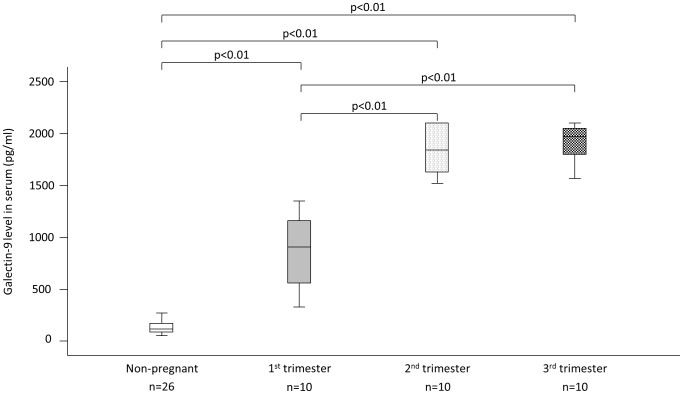
Figure 4. Circulating Galectin-9 levels throughout pregnancy and in non-pregnant women.
Serum Galectin-9 levels of normal pregnant women during each trimester of pregnancy and in non-pregnant women. The solid bars represent medians; the boxes indicate the interquartile ranges and the lines show the most extreme observations. Differences were considered statistically significant for P-values ≤0.05.

