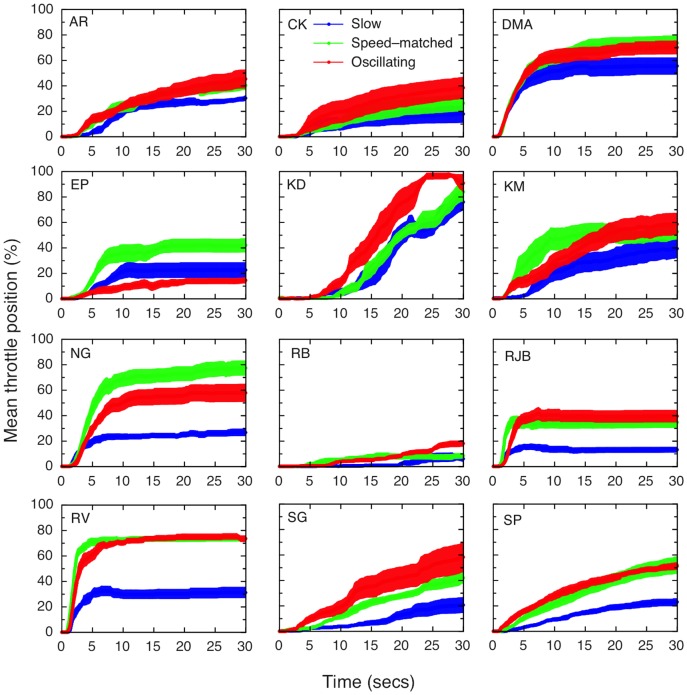
Figure 3. Individual throttle traces for each participant over the three conditions, averaged across 8 trials.
It is clear that, for the majority of the participants, the speed-matched (green) and oscillating (red) stimuli produced very similar throttle ratings. The position of the throttle device was sampled at 100 Hz, the same as the frame rate, and participants reset the device to the zero position in between trials. Shaded areas show  1 standard error of the mean throttle position at each sampled location over the 8 trials.

