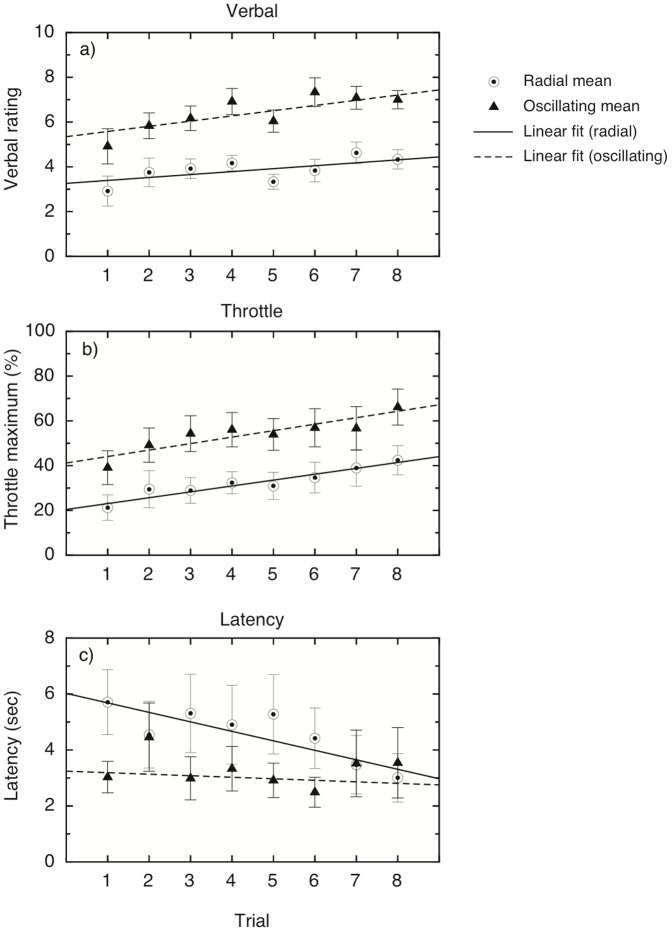
Figure 4. Trial-by-trial analysis of the ratings from Experiment 1.2.
Results are averaged over 12 participants: a) Verbal vection ratings (0–10) for smooth (4 m/s) and oscillating (4 m/s) flow, shown over 8 trials; b) maximum throttle setting reached, as a percentage of the total possible range; c) mean vection onset latency, measured in seconds, as given by the time taken for the throttle to be moved to a cutoff value of 5% of the maximum value. Error bars show  1 standard error in all graphs.

