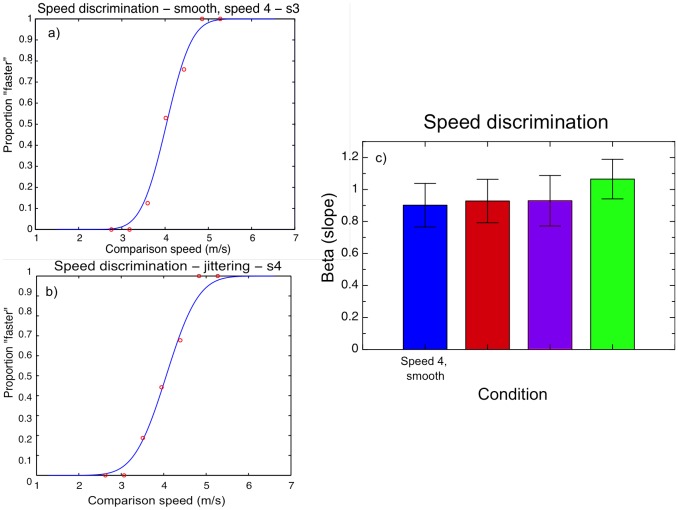
Figure 9. Precision estimates (betas) for discriminating the different MID stimuli.
a) and b) Representative psychometric functions for two observers, pooling across 50 trials, for smooth (a) and jittering (b) MID stimuli. The functions are cumulative Gaussian fits using Maximum Likelihood Estimation. c) Mean slopes for each condition across all observers (n = 10). Error bars show +/− 1 standard error.

