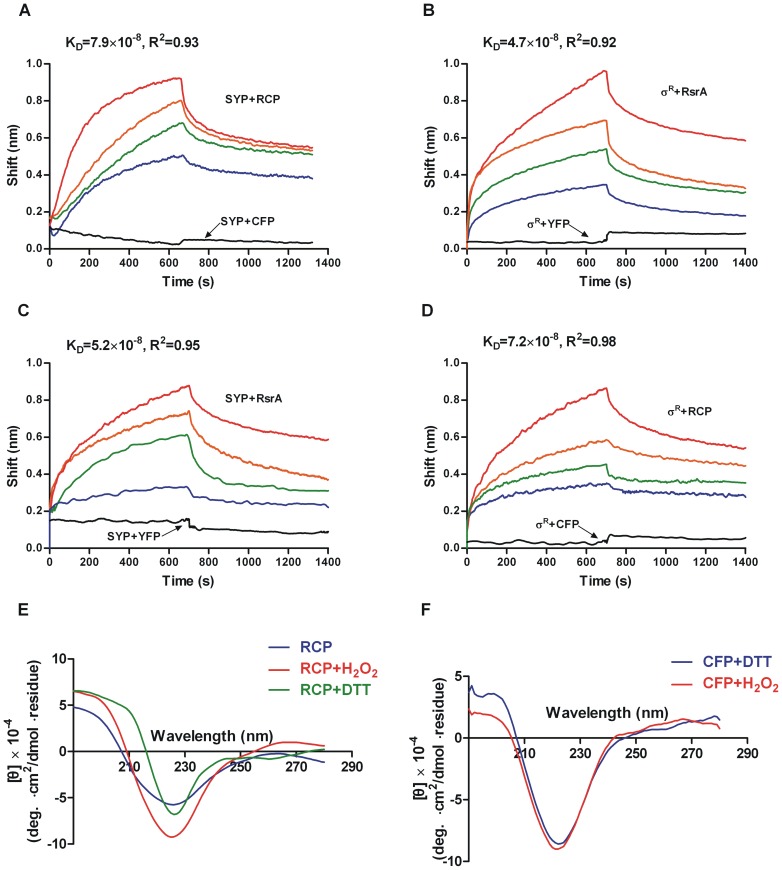
Figure 2. Function confirmation of the FRET-based probes by biolayer interferometry and Circular dichroism.
Sensorgrams of SYP ligand on Streptavidin-coated biosensors binding to different concentrations of RCP (A) or RsrA (C), and σR ligand binding to different concentrations of RCP (B) or RsrA (D) are shown. Black lines show binding of ligands to fluorescence proteins as reference. The binding affinity parameter KD is calculated and shown above binding curve for each measurement. R2 is the coefficient of determination estimating the goodness of a curve fit reported by Fortebio Data Analysis software version 7.0. Circular dichroism spectra of RCP in different redox environments were measured. (E) Secondary structure characterization (blue line) and conformational change of RCP in response to H2O2 (red line) and DTT (green line) after subtracting baseline of buffer are shown from 190 nm to 280 nm. (F) Conformational change of CFP in response to the redox environment (red line shows H2O2 and blue line shows DTT) as control.

