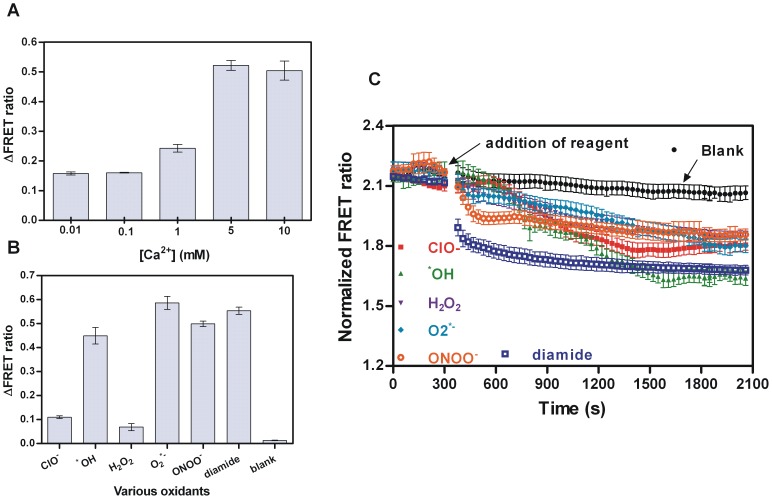
Figure 6. Application of RsrA based biosensor detecting redox environment.
(A) Effect of Ca2+ on sensitivity of of BL21 to high concentrations of H2O2. The increasing concentrations of Ca2+ as shown on graph were incubated with sensor and the values of ΔFRET ratio were obtained. (B) Sensor containing BL21 in response to the same concentration of various ROS as described in Materials and Methods. The ΔFRET ratio of each oxidant (shown on graph) was obtained. All data represent the means ± SEM of three independent measurements. (C) Time course of sensor monitoring changes in redox status induced by various ROS in BL21. Addition of appropriate concentration of ROS is indicative at 5 minute time point. The addition operation interrupted the measurement for approximate 7 s. The black points present the reference with addition of buffer. The data from each assay was normalized.

