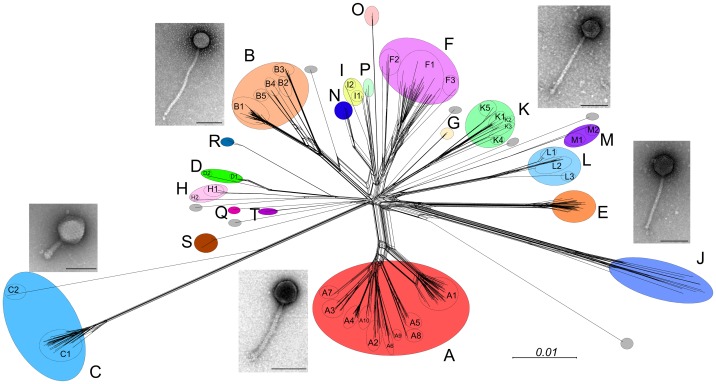
Figure 1. Diversity of mycobacteriophages.
Sequenced genomes for 471 mycobacteriophages were compared according to their shared gene contents, and the relationships are displayed using Splitstree [24]. The genomes are clustered according to overall nucleotide sequence similarity, and the clusters (A, B, C…) correlate closely with their gene content. Colored circles encompass Clusters A–T as indicated, and grey circles represent singleton genomes that have no close relatives. Ten of the clusters are divided into subclusters (e.g., A1, A2, A3….) and are shown as circles within each cluster. Micrographs show the two morphotypes observed, typified by the myoviral Cluster C phages and the siphoviruses (all others) that primarily differ in tail length (scale bars, 100 nm). With the exception of one singleton (DS6A), all of the phages infect M. smegmatis mc2155. DS6A, the Cluster K phages and a subset of Cluster A phages also infect M. tuberculosis.

