
Figure 6. Evolutionary distances of each single-genome sequence from pre-cART and during and after cART compared to the consensus subtype B HIV-1 sequence and plotted over (A) short-term cART (B) long-term cART (C) long-term cART with brief treatment interruptions and (D) rebound viremia.
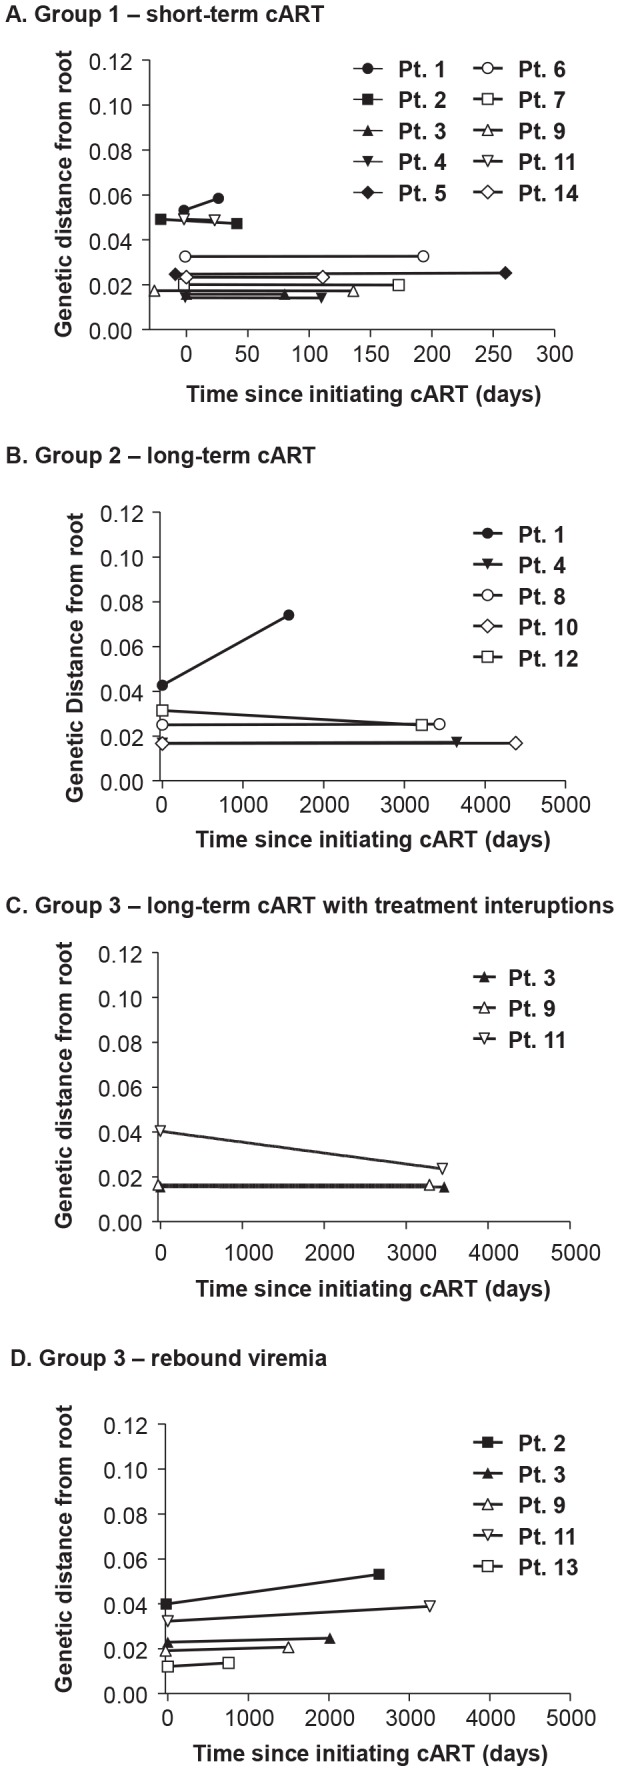
Positive slopes indicate the emergence of new variants and on-going replication during cART. Only one patient (PID 1) showed a positive slope and evidence of molecular evolution during cART.