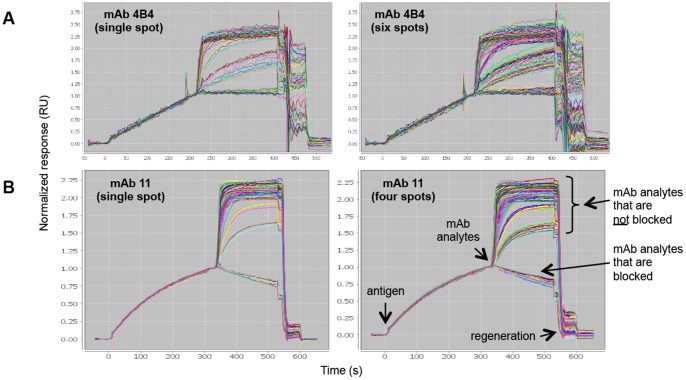
Figure 2. SPRi analysis of epitope binning assays on independent arrays using a classical sandwich assay format.
The model antigens used were (A) rhPGRN and (B) rIsdB. Each overlay plot shows the sensorgrams for 100 binning cycles (i.e., 96 mAb analytes and buffer blank analytes) on a single spot (left) or replicate spots (right) of a coupled mAb, as indicated. Responses are normalized to 1 at the end of the antigen capture step to facilitate the comparison of different capacity spots.

