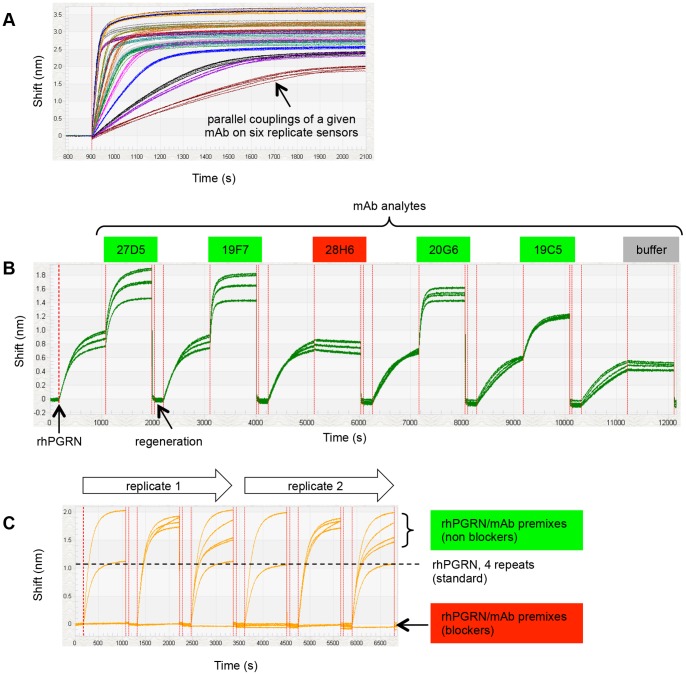
Figure 4. BLI analysis of sixteen anti-hPGRN mAbs using complementary epitope binning assay formats.
(A) Overlay plot for the coupling of 96 mAbs on parallel sensors (six replicate sets of sixteen mAbs). (B) Sensorgrams obtained from a classical sandwich assay on six sensors coupled with mAb 1B8 (the sensorgrams cluster into three pairs of curves because the couplings were performed on duplicate sensors in three consecutive runs). Analytes highlighted in green have different epitopes than the ligand (i.e., 1B8 does not block 27D5, 19F7, 20G6, or 19C5) whereas the analyte highlighted in red has an epitope that overlaps with that of the ligand (i.e., 1B8 blocks 28H6). (C) Sensorgrams obtained from a premix assay on six sensors coupled with mAb 2B2 (the same analyte wells were tested in duplicate cycles). Panels B and C are representative of the much larger data sets generated in those experiments. Response data are aligned to zero at the start of the sensorgrams.

