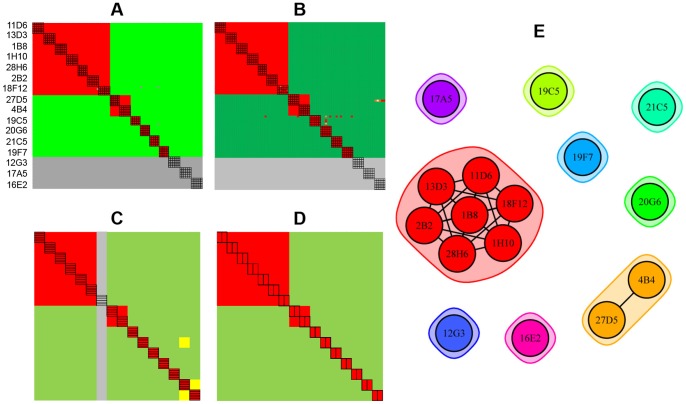
Figure 5. Technology comparison of epitope binning assays on sixteen anti-hPGRN mAbs using complementary assay formats.
Heat maps for (A) SPRi – classical sandwich, (B) SPRi – premix, (C) BLI – classical sandwich, and (D) BLI – premix experiments. (E) Node plot of the deduced bin assignments from panels A–D. All experiments were conducted on a 96-ligand array (i.e., sixteen mAbs coupled onto six surfaces each). Sixteen mAbs were each used as analyte (A) up to six times, (B) up to five times, (C) once, and (D) twice. In the heat maps, the rows represent the ligands and the columns represent the analytes, in the same order. Analyte/ligand pairs are assigned as blocked (red), not blocked (green), or ambiguous (yellow), and self-blocks are outlined with a black box. Panels A, B and D each represent the results for a single experiment, whereas panel C represents the consolidated results from three separate experiments on the same sensors, because the autosampler capacity allowed for a maximum of five mAb analytes per experiment. Grey rows in panels A and B indicate inactive ligands and the grey columns indicate mAbs that were not tested as analyte.

