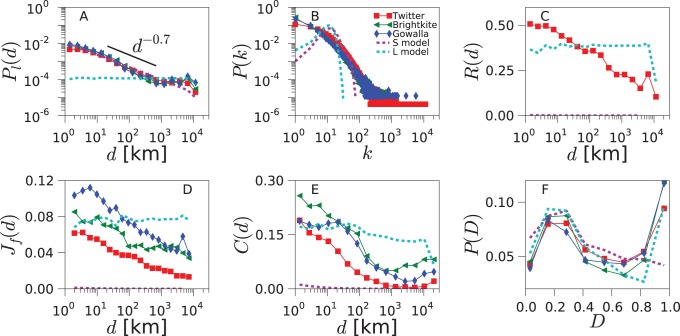
Figure 2. Network geo-social properties.
Various statistical network properties are plotted for the data obtained from Twitter (red squares), Gowalla (blue diamonds), Brightkite (green triangles) and the null models (dashed lines), for the US (for the UK and Germany, see Figures S1 and S2). The spatial model (magenta), based on geography, matches well the data in  , but yields near-zero values for
  ,
,  and
and  . The linking model (cyan), based on triadic closure, produces enough clustering, but it does not reproduce the distance dependencies of
  ,
,  ,
,  and
and  .
.

