
Figure 3. Fitting the TF model.
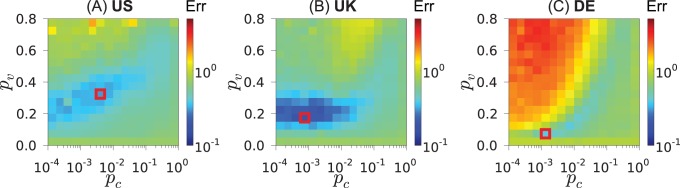
Values of the error Err when p
v and  are changed. The minimum error for each of the plots is marked with a red rectangle.
Official websites use .gov
A
.gov website belongs to an official
government organization in the United States.
Secure .gov websites use HTTPS
A lock (
) or https:// means you've safely
connected to the .gov website. Share sensitive
information only on official, secure websites.
Values of the error Err when p
v and are changed. The minimum error for each of the plots is marked with a red rectangle.