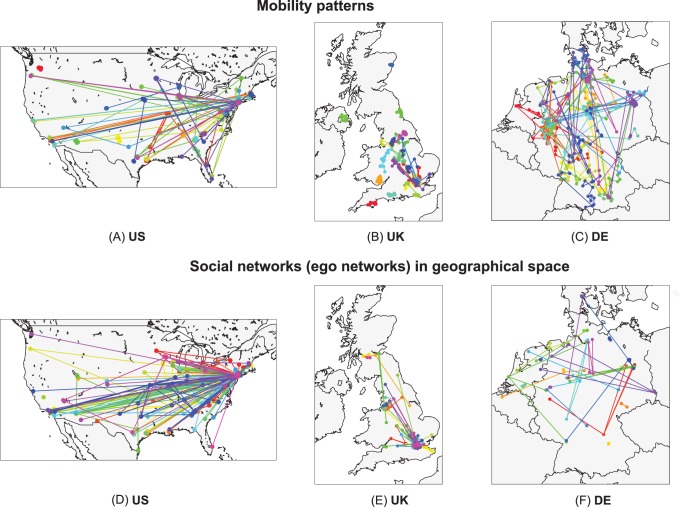
Figure 4. Simulation results: mobility and social networks.
Mobility (upper row) and ego networks (lower row) of 20 random users (different colors) for the instances of the TF model yielding the lowest error Err (see Figure 3). Mobility network shows mobility patterns of individual users throughout entire simulation. Ego network shows the social connections at the end of the simulation.

