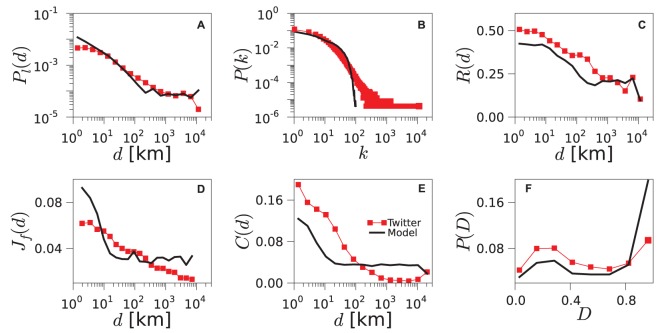
Figure 5. Geo-social properties of the model networks.
Various statistical properties are plotted for the networks obtained from Twitter data (red squares) and from simulation of the TF model (black line) for the US. Corresponding results for the UK and Germany can be found in Figures S3 and S4.

