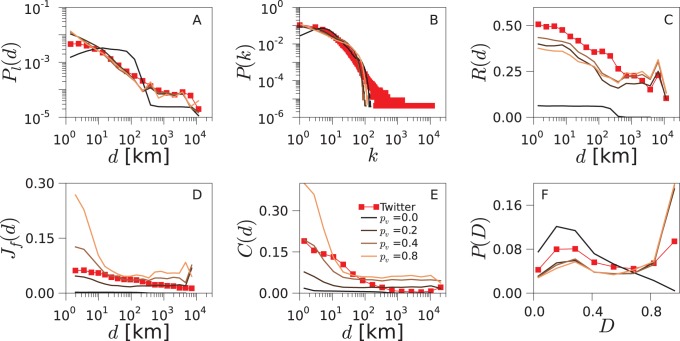
Figure 7. Impact of p v on the TF model.
We change the value of p
v while keeping  fixed to the optimal value. Note that this corresponds to an exploration of the parameter space along the vertical line crossing the minimum of Err as plotted in Figure 3 for the US. Corresponding results for the UK and Germany can be found in Figures S5 and S6.

