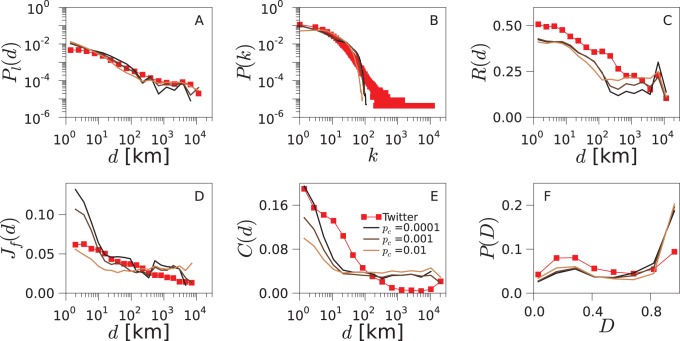
Figure 8. Impact of  on the TF model.
We change the value of  while keeping p
v fixed to its optimal value. Note that this corresponds to an exploration of the parameter space along the horizontal line crossing the minimum of Err as plotted in Figure 3 for the US. Corresponding results for the UK and Germany can be found in Figure S7 and S8.

