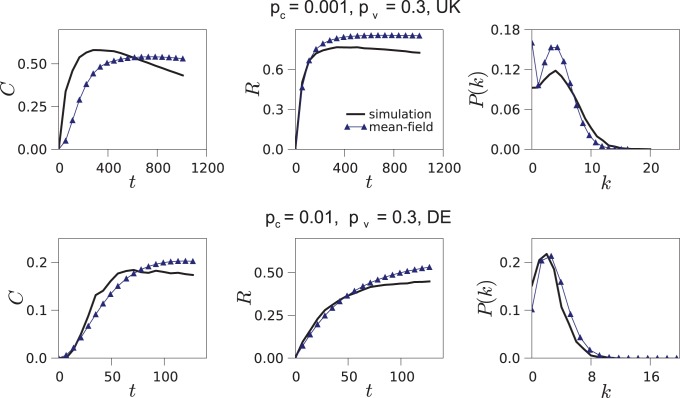
Figure 9. Mean-field approximation.
Predictions of the analysis versus results of the simulation of the L model for the clustering coefficient C, the reciprocity R and the degree distribution  . In this case, we are taking the users from the UK and Germany because their lower numbers facilitate the numerical integration of the Equations 6, 8, 9, 11 and 12.

