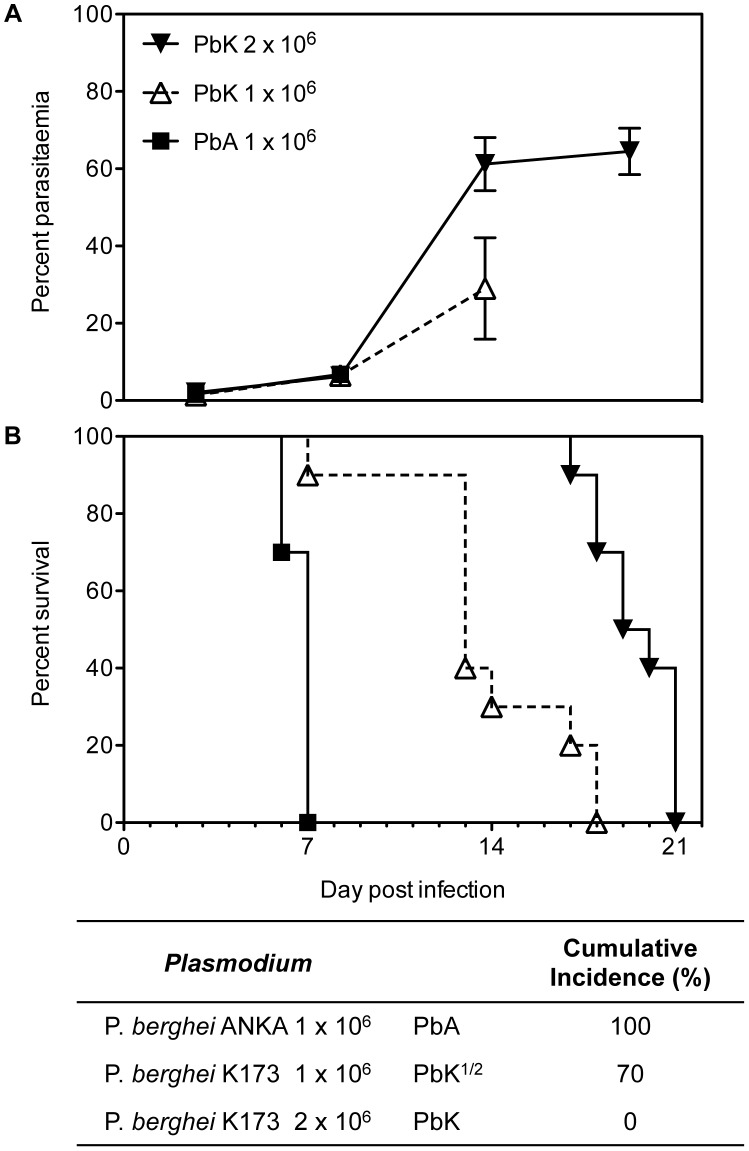
Figure 1. Parasitaemia and survival curves of Plasmodium berghei.
PbK-infection at the non-encephalitogenic dose was used to model NCM (closed triangle), PbK-infection at the encephalitogenic dose (PbK1/2, open triangle) and PbA-infection to model CM (closed square) (n = 10). (A) Parasitaemia and (B) survival curves during the course of the infections. No difference in percentage parasitaemia on day 7 p.i by the Mann Whitney test: PbK (closed triangle) vs PbK1/2 (open triangle) p = 0.6286; PbK1/2 (open triangle) vs PbA (closed square) p = 1; PbK (closed triangle) vs PbA (closed square) p = 0.5333. Note, parasitaemia values for PbA infected mice after day 7 are not shown, since none were surviving. Parasitaemia values for PbK and PbK1/2 after day 7 p.i diverge. Parasitaemia is shown as mean ± SD. CBA mice (n = 10, per group) infected with PbK1/2 or PbA parasites develop CM, with a cumulative incidence of 70% and 100% respectively. Comparison of survival curves PbK (closed triangle) vs PbK1/2 (open triangle): Log-rank (Mantel-Cox) Test p<0.001 and Gehan-Breslow-Wilcoxon Test p<0.002. PbK1/2 (open triangle) vs PbA (closed square): Log-rank (Mantel-Cox) Test p<0.001 and Gehan-Breslow-Wilcoxon Test p<0.001. PbK (closed triangle) vs PbA1/2 (closed square): Log-rank (Mantel-Cox) Test p<0.001 and Gehan-Breslow-Wilcoxon Test p<0.001.

