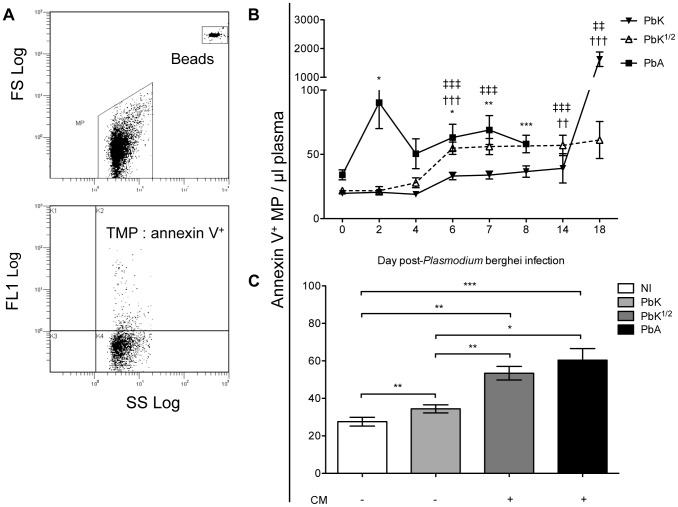
Figure 2. Total plasma microparticle levels during Plasmodium berghei infection.
(A) Cytogram representation of total Annexin V+ MP per µL of plasma in infected CBA mice. MP were gated for their size and further analysed for positive Annexin V+ populations. Calibrated fluorescent latex beads of a known size and concentration were used as an internal standard to calculate MP levels. (B) Increase in total Annexin V+ MP following Plasmodium berghei infection. Mice infected with 1×10⁶ PbA (closed square) display a biphasic production of MP, peaking at day 2 and day 7, which is not observed in mice infected with PbK (closed triangle) or PbK1/2 (open triangle). MP levels are plotted in MP/µL of plasma; 1-way ANOVA, Kruskall-Wallis & Dunns post-test *p<0.05, **p<0.001, ***p<0.0001. Annexin V+ labelling was performed on 5 PFP samples from each mouse. Data shown from n = 10 PbK (closed triangle) and n = 5 PbK1/2 infected (open triangle) mice on day 0, 2, 4, 6, 7, 14 and 18. Data shown from PbA infected mice (closed square) n = 11 day 0, n = 10 day 2, n = 10 day 4, n = 12 day 6, n = 6 day 7, n = 5 day 8. (C) Annexin V+ MP per µL of plasma at time of CM onset. CM+ mice (i.e. Infected with PbK1/2 (dark grey) or PbA (black)) have higher levels of circulating MP than CM− mice (i.e. non-infected (white) and PbK infected mice (light grey)). Data from PbK1/2 infected mice that did not display signs of CM are not shown. Mann Whitney t-test *p<0.05, **p<0.001, ***p<0.0001.

