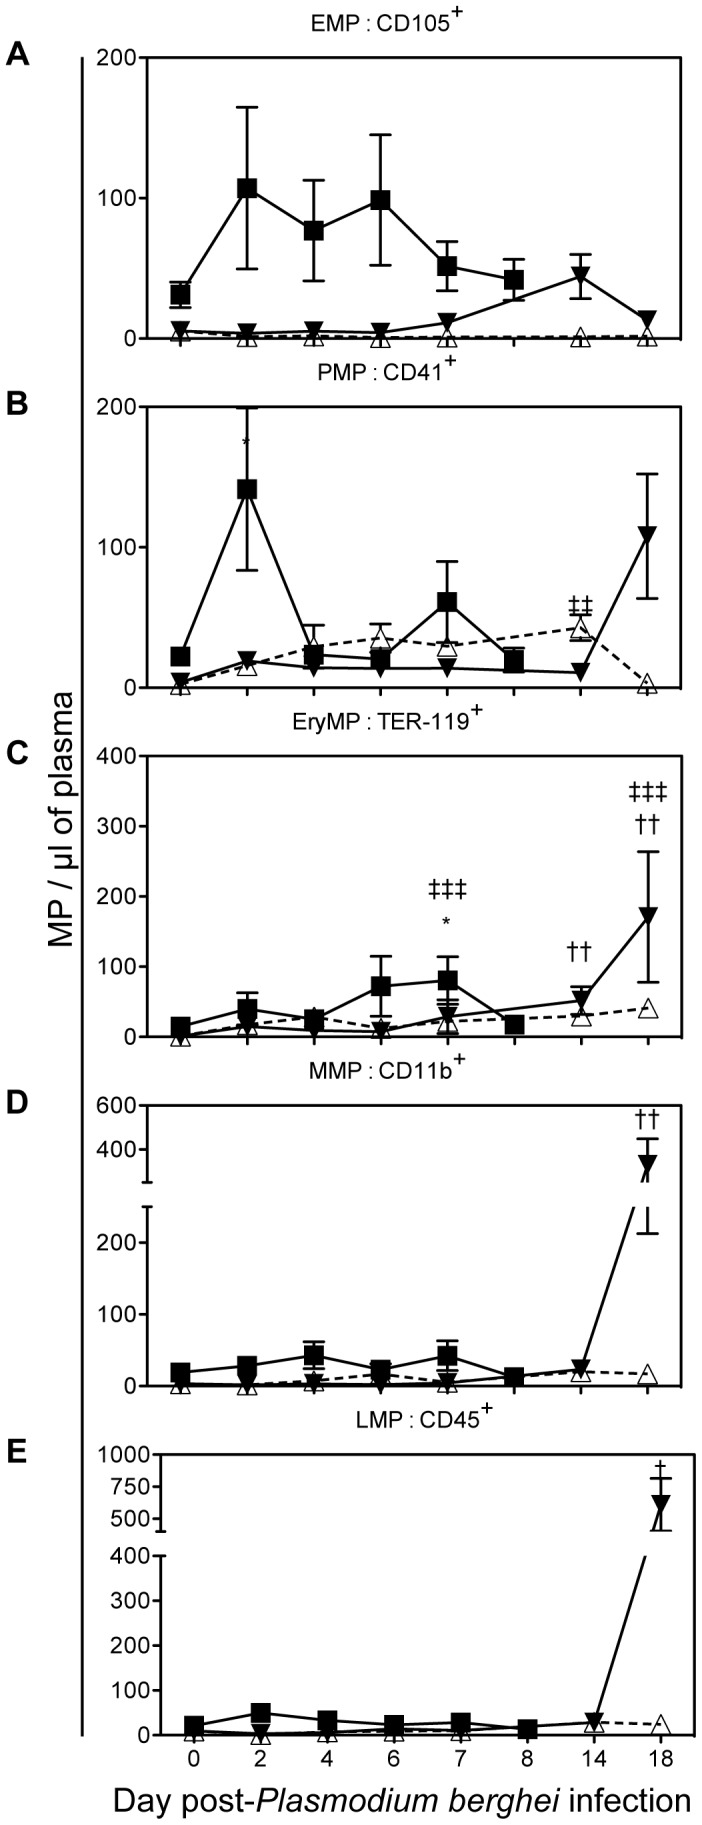
Figure 3. Cell-specific MP in plasma during the course of Plasmodium berghei infection of CBA mice.

PbK (closed triangle), PbK1/2 (open triangle) or PbA (closed square) (A) PMP/µL plasma; (B) EMP/µL plasma; (C) RMP/µL plasma; (D) MMP/µL plasma; (E) LMP/µL plasma. Data shown from n = 10 PbK- (closed triangle) and n = 5 PbK1/2 infected (open triangle) mice on day 0, 2, 4, 6, 7, 14 and 18. Data shown from PbA infected mice (closed square) n = 11 day 0, n = 10 day 2, n = 10 day 4, n = 12 day 6, n = 6 day 7, n = 5 day 8 and represented as mean ± SEM *p<0.05, **p<0.001, ***p<0.0001. Inconsistencies in sample group size are due to the fragile health status of mice during the period of morbidity.
