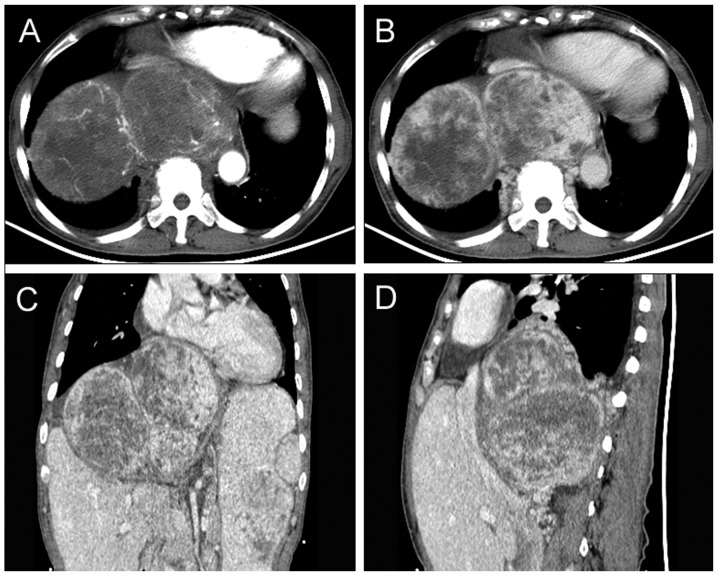
Figure 2.
(A) Arterial-phase CT scan. The tumor shows moderate to marked enhancement, with the tumor edge visible for tortuous vascular shadow. (B) Venous-phase CT scan demonstrating sustained enhancement of the tumor. Nonenhanced areas suggest central cystic degeneration and necrosis. (C) Coronal and (D) sagittal reconstructed images: The tumor is lobulated, comprised of three masses. The heart, liver and right kidney were pressured significantly due to the tumor mass effect. CT, computed tomography.

