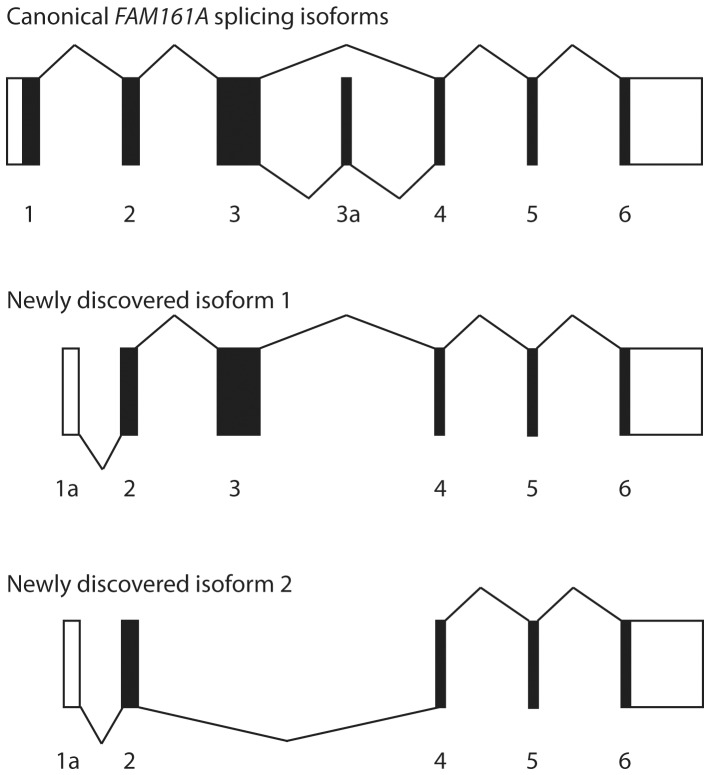
Figure 2. Schematic representation of alternative splicing events of FAM161A transcripts.
Boxes represent exons, while lines represent splicing events. Coding regions are in black, noncoding regions are white. The canonical forms of FAM161A mRNA are presented in the top panel, as reference. The bottom two panels show newly-discovered splicing isoforms with an alternative 5′UTR in intron 1 (1a).

