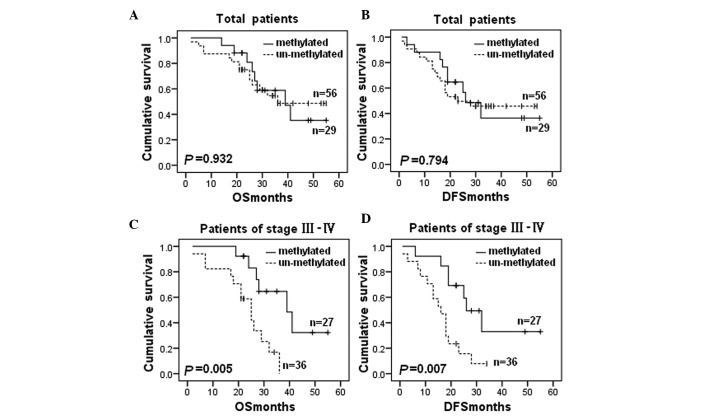
Figure 2.
Kaplan-Meier curves for OS and DFS according to the BRCA1 methylation status. (A) BRCA1 methylation and OS in all cases (P=0.932). (B) BRCA1 methylation and DFS in all cases (P=0.794). (C) BRCA1 methylation and OS in the subgroups of stage III–IV cases (P=0.005). (D) BRCA1 methylation and DFS in the subgroups of stage III–IV cases (P=0.007). P-value obtained from log-rank test. OS, overall survival; DFS, disease-free survival; BRCA1, breast cancer susceptibility gene 1.

