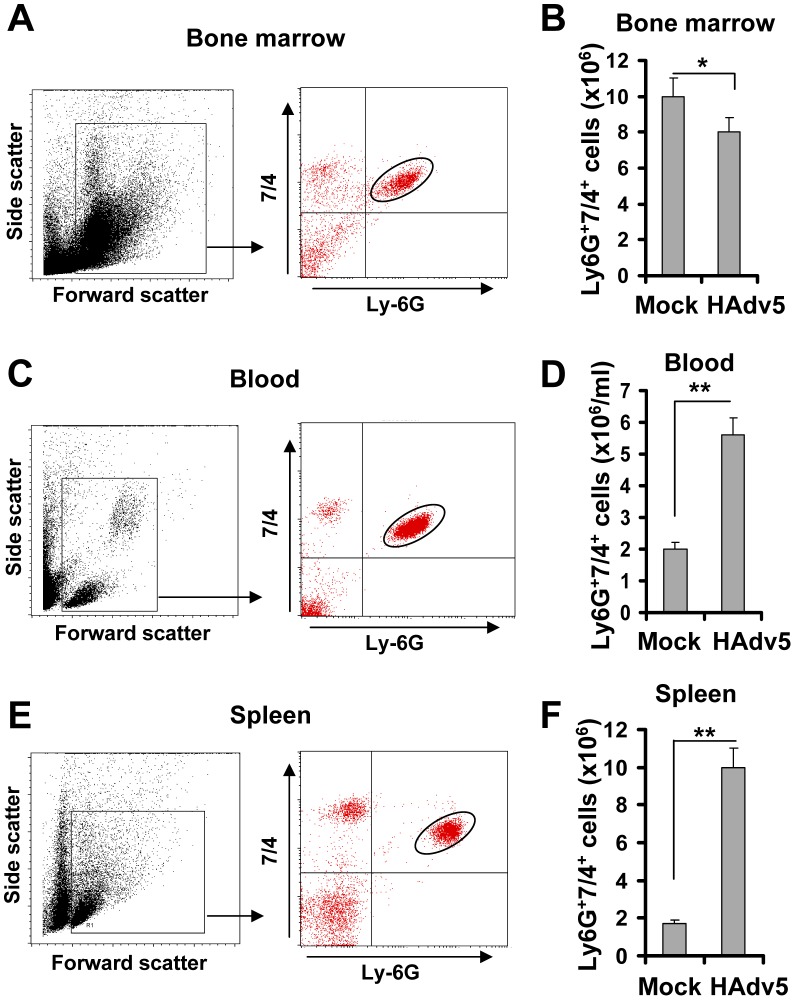
Figure 1. Intravascular adenovirus administration leads to the release of Ly-6G+7/4+ polymorphonuclear leukocytes from bone marrow into the blood and their retention in the spleen.
Dot-plot of the forward and side light scatters of leukocytes in the bone marrow (A), blood (C), and spleen (E) and their analysis for expression of Ly-6G and 7/4 cell surface marker using flow cytometry. The representative dot-plots, obtained from five mice are shown. The population of cells that stained positive for both markers is depicted on the right panel with an oval. Quantification of Ly-6G+7/4+ cells in the bone marrow (B) (the absolute numbers shown are for one femur bone), blood (D) and spleen (F) of mice injected with saline (Mock group) or Ad vector (HAdv5 group). The data was collected from three independent experiments, N = 5. * - P<0.05; ** - P<0.01.

