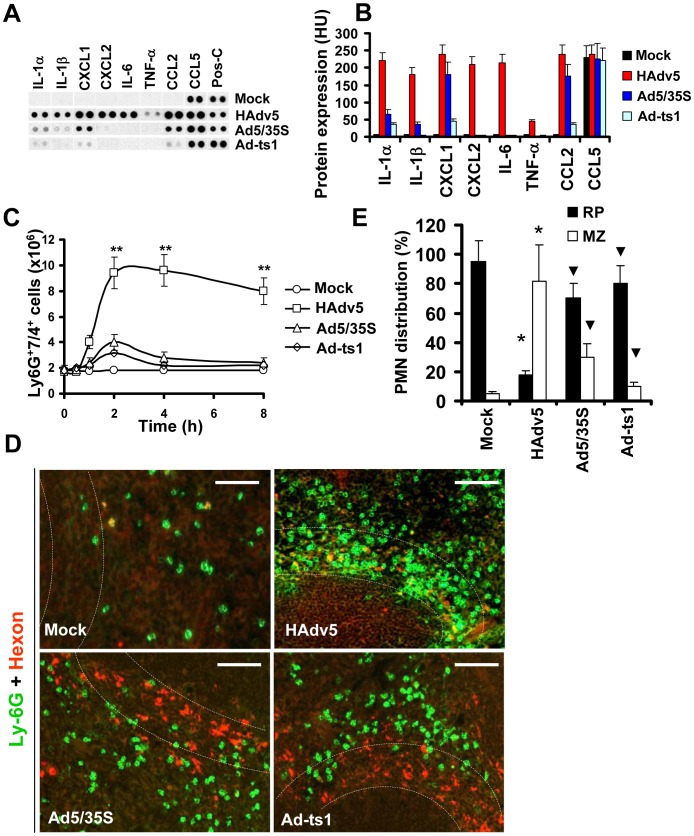
Figure 4. Localization of Ly-6G+ cells to the splenic MZ occurs in response to pro-inflammatory stimuli.
(A) Mouse cytokine array panel showing differences in the proinflammatory cytokines and chemokines in spleen of wild type mice injected with saline (Mock), Ad5 (HAdv5), Ad5/35S, and Ad-ts1 viruses 1 hour after virus injection, determined by Proteome Profiler antibody array. Representative blots from four independent experiments are shown. Pos-C are dots that show the manufacturer's internal positive control samples on the membrane. Mock – the spleen protein sample of a mouse injected with saline. (B) The amounts of proinflammatory cytokines and chemokines in the spleens of mice 1 hour after Ad injection. HU – histogram units. Graphs show means ± s.d. n = 4. Mock – negative control mice injected with saline. (C) Kinetics of Ly-6G+7/4+ leukocyte accumulation in the spleen after injection of mice with 1010 virus particles of Ad5 (HAdv5), Ad5/35S and Ad-ts1 viruses. The data obtained from three independent experiments is shown. Mock group of mice was injected with phosphate-buffered saline (PBS) only. Splenocytes were harvested, stained with antibodies for Ly-6G and 7/4 cellular markers and analyzed by flow cytometry. N = 4. ** - P<0.01. Error bars represent standard deviation of a mean. (D) Distribution of Ly-6G+ leukocytes on sections of the spleens harvested from mice injected 1010 virus particles of Ad (HAdv5), Ad5/35S, and Ad-ts1. Mock – mice were administered with saline. The MZ is outlined by the dotted lines. Spleen sections were simultaneously stained with FITC anti-Ly-6G (green) and anti-Ad-hexon (red) antibodies and pictures were taken using a Leica fluorescent microscope. Representative spleen sections for each experimental setting are shown. N = 5. Scale bar is 75 µm (E) Quantitative representation of Ly-6G+ (PMN) distribution on sections of the spleens of mice administered with 1010 virus particles of indicated viruses 2 hours after virus challenge. The quantification of Ly-6G+ cell distribution was done as described in Figure 3B. N = 5. RP – red pulp; MZ – marginal zone. * - P<0.05, compared to corresponding Mock groups. Inverted triangle – P<0.05, compared to Ly-6G+ cell distribution observed for corresponding compartments in mice administered with HAdv5. Error bars represent standard deviation of a mean.

