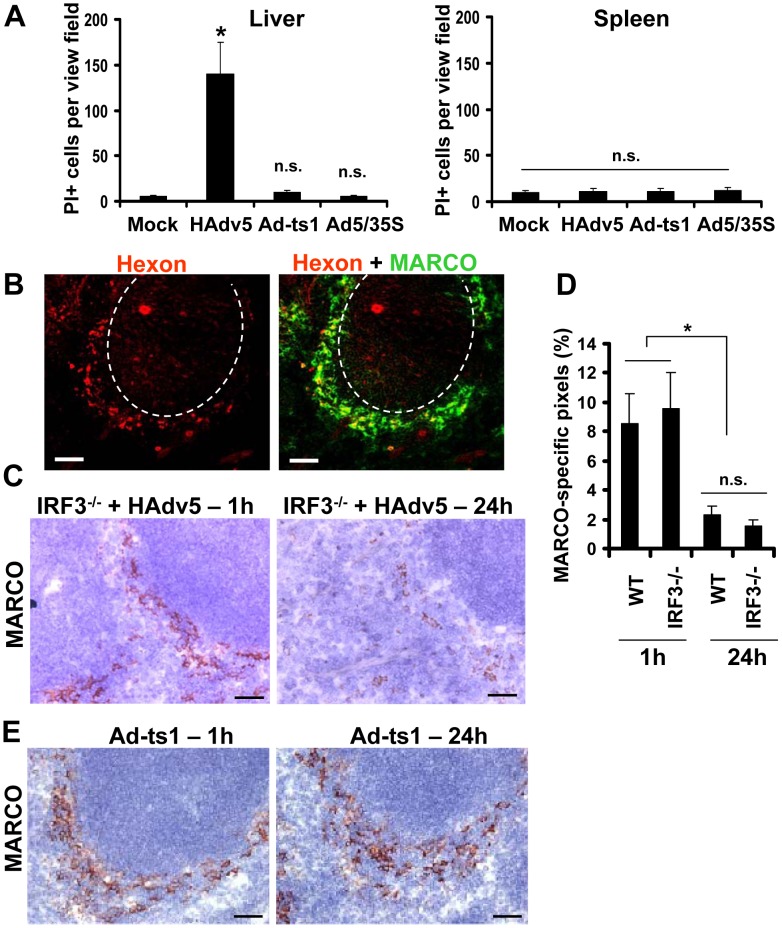
Figure 8. MARCO+ cells are eliminated from the splenic MZ through an IRF3-mediated necrosis-independent pathway.
(A) Quantification of propidium iodide (PI)-positive cells on unprocessed sections of livers and spleens of mice injected with 1010 virus particles of Ad (HAdv5), Ad-ts1, or Ad5/35S viruses 1 hour after the virus challenge. Mice were injected with indicated viruses intravenously and 1 hour later, mice were administered with PI and sacrificed 5 minutes later. Spleens and livers were harvested for histological analyses. Four sections of the spleen at three depth levels were prepared for each mouse and the number of PI-positive cells per low-power view-field was quantified. N = 5. * - P<0.05. n.s. – not significant. Mock – control group of mice injected with saline. (B) Distribution of Ad particles (stained with anti-Hexon Ab, red) and MACRO+ cells (stained with anti-MARCO Ab, green) on spleen sections of Irf3 −/− mice 1 hour after intravascular virus injection. Co-localization of virus particles with MARCO+ staining appears as yellow. The anatomic borders of splenic germinal centers are depicted with dotted lines. Scale bar is 50 µm. Representative images are shown. N = 8. (C) Immunohistochemical analysis of MARCO+ marginal zone macrophages on sections of spleens of Irf3 −/− mice at different times after Ad administration. Spleens of Irf3 −/− mice injected with the virus were harvested at indicated times and stained with MARCO-specific antibodies. Sections were counter-stained with hematoxylin to visualize splenic anatomical compartments. Representative fields are shown. N = 5. Scale bar is 40 µm (D) Quantitative representation of MARCO+-specific staining on splenic sections of WT and Irf3 −/− mice after Ad administration. N = 4 per experimental group per time point. Marker-specific pixels (brown staining) were quantified using MetaMorph software on low-power images of spleen sections with average distribution of MARCO-specific staining collected from three sections and at three depth levels. * - P<0.05. Error bars represent standard deviation of mean. (E) Immunohistochemical analysis of MARCO+ marginal zone macrophages on sections of spleens of WT mice at 1 hour and 24 hours after administration of Ad-ts1 virus. Spleens of mice injected with Ad-ts1 virus were harvested at indicated times and stained with MARCO-specific antibodies. Sections were counter-stained with hematoxylin to visualize splenic anatomical compartments. Representative fields are shown. N = 5. Scale bar is 40 µm.

