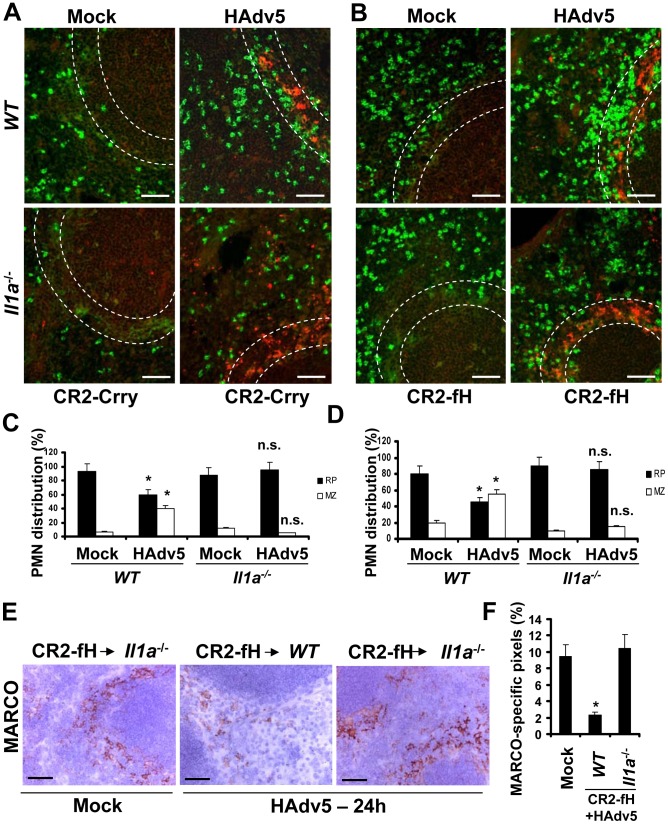
Figure 10. IL-1α-dependent signaling and complement cooperate in promoting the recruitment of Ly-6G+ leukocytes that eliminate MARCO+ cells from the splenic MZ.
(A) Distribution of Ly-6G+ leukocytes on sections of the spleens harvested from WT and Il1a −/− mice pre-treated with complement activation inhibitor CR2-Crry (50 µg/mouse) 1 hour prior to Ad injection. Spleen sections were simultaneously stained with FITC anti-Ly-6G (green) and anti-Ad-hexon (red) antibodies and pictures were taken using a Leica fluorescent microscope. Representative spleen sections for each experimental setting are shown. N = 5. Scale bar is 50 µm. (B) Distribution of Ly-6G+ leukocytes on sections of the spleens harvested from WT and Il1a −/− mice pre-treated with alternative complement activation pathway inhibitor CR2-fH (50 µg/mouse) 1 hour prior to Ad injection. Spleen sections were simultaneously stained with FITC anti-Ly-6G (green) and anti-Ad-hexon (red) antibodies and pictures were taken using a Leica fluorescent microscope. Representative spleen sections for each experimental setting are shown. N = 5. Scale bar is 50 µm. (C–D) Quantitative representation of Ly-6G+ (PMN) distribution on sections of the spleens of WT and Il1a −/− mice pre-treated with CR2-Crry (C) or CR2-fH (D) complement inhibitors 1 hour prior to Ad administration. The quantification of Ly-6G+ cell distribution was done as described in Figure 3B. N = 5. RP – red pulp; MZ – marginal zone. * - P<0.05, n.s.- not significant compared to corresponding mock (saline-injected) groups. (E) Immunohistochemical analysis of MARCO+ marginal zone macrophages on sections of spleens of mock-injected or Ad-injected (HAdv5) Il1a −/− mice pre-treated with CR2-fH 1 hour prior to Ad administration. The scale bar is 40 µm. Representative pictures are shown. N = 5. (F) Quantitative representation of MARCO+-specific staining on splenic sections of WT and Il1a −/− mice pre-treated with 50 µg of CR2-fH complement inhibitor prior to Ad administration (HAdv5). N = 4 per experimental group per time point. Marker-specific pixels (brown staining) were quantified using MetaMorph software on low-power images of spleen sections with average distribution of MARCO-specific staining collected from three sections and at three depth levels. * - P<0.05. Error bars represent standard deviation of mean.

