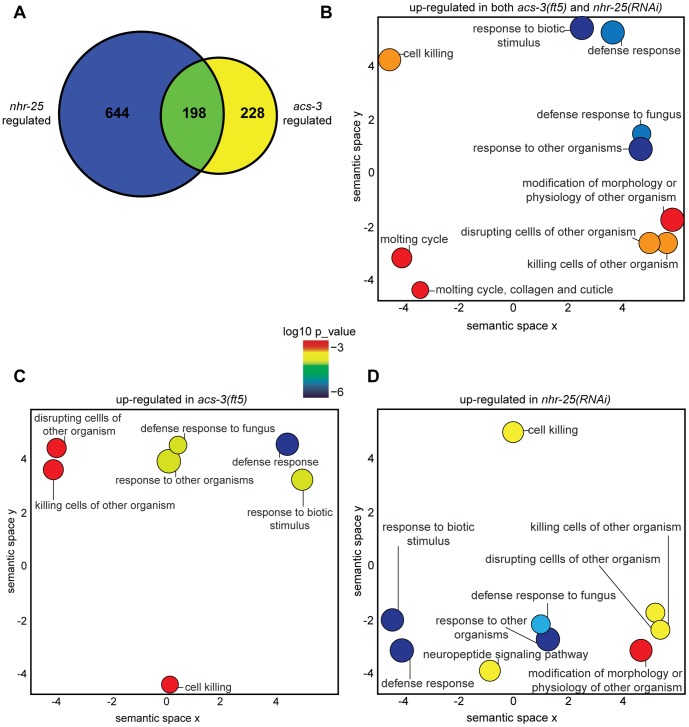
Figure 1. acs-3 and nhr-25 regulate similar genes involved in pathogen response and molting.
(A) Venn diagram of the overlap between genes differentially up-regulated and down-regulated in the (WT vs acs-3(ft5)) and (control vector (RNAi) vs nhr-25(RNAi)) microarray datasets. Gene lists are provided in Tables S1-4. (B–D) Analysis of enriched biological functions as determined by GORILLA-REVIGO analysis. Enriched biological processes in genes up-regulated in both acs-3(ft5) and nhr-25(RNAi) animals (B), in acs-3(ft5) mutants (C), and in nhr-25(RNAi) animals (D) using the GO visualization tool REVIGO [22]. Using this tool, similar functional categories cluster together in two-dimensional space. REVIGO uses a simple clustering algorithm to represent GO data and represents the semantic similarity of the data on the x- and y-axes. Bubble color indicates p-value derived from the Gene Ontology enRIchment anaLysis and visualization tool (GORILLA), and bubble size is proportional to the frequency of GO terms in the Gene Ontology Annotation database. Colors corresponding to log10 p-value are provided in the legend.

