
Figure 3.
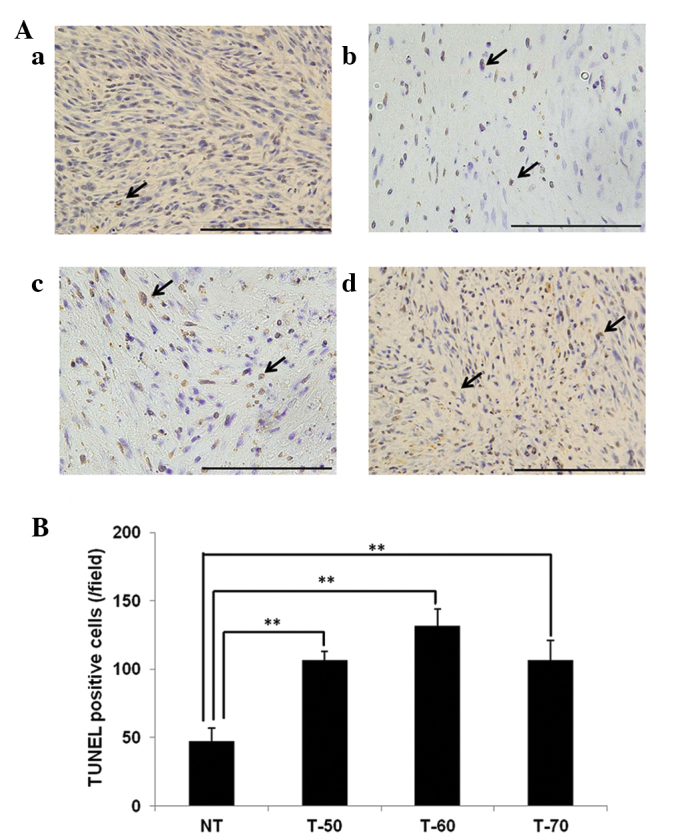
Effects of high-temperature hyperthermia on the number of TUNEL-positive cells in the tumor tissue. (A) The tumor tissue sections were stained with TUNEL (bar, 100 μm). Data are presented for one mouse each for the (a) NT, (b) T-50, (c) T-60 and (d) T-70 groups. (B) The numbers of TUNEL-positive cells were calculated. The data are presented as the mean ± standard error of the mean for each group. Statistical significance was determined according to the Steel-Dwass test; **P<0.01. TUNEL, terminal dUTP nick-end labeling; NT, nontreatment; T-50, 50° high-temperature hyperthermia; T60, 60° high-temperature hyperthermia; T-70, 70° high-temperature hyperthermia.