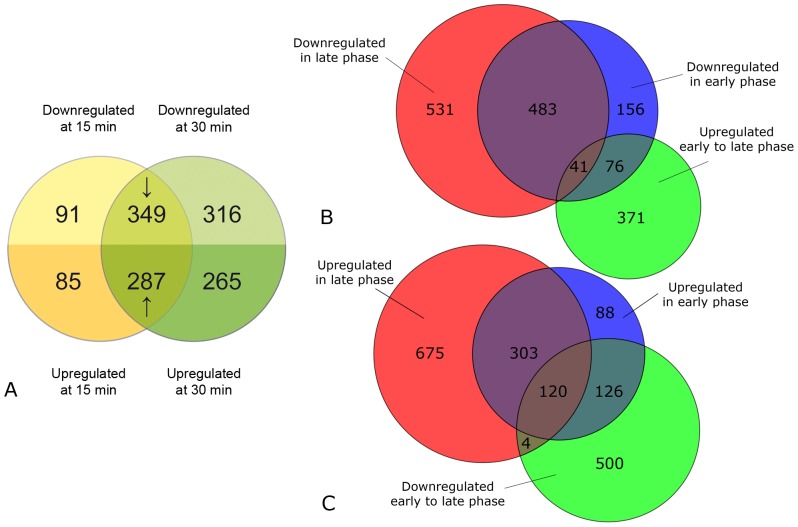
Figure 3. Overall transcriptional response to nitrogen starvation in response and adaptation phases.
(A) 756 genes were significantly down-regulated (upper half of circles, ↓) and 637 up-regulated (lower half, ↑) at least two-fold during the nitrogen starvation response phase (030 min). Few genes were specific for the very early response (yellow, 15 min), and most were either common to 15 and 30 min of starvation or specific for 30 min (green). (B) Early down-regulation continues into the late nitrogen starvation response. Of the 756 genes which were down-regulated in the response phase (blue), a significant proportion stayed down-regulated as part of the late phase response (red). A smaller subset (117 genes) was among the genes which were up-regulated between early and late phase (green). Of those 41 were up-regulated between early and late phase, but still remained on a very low expression level compared to the onset of starvation. Additional 531 genes were specifically down-regulated in the late phase of starvation (red). (C) Early up-regulation is partly reversed in the later starvation phases, Of the 637 genes up-regulated in early phase of starvation (blue), about half stayed highly expressed in the late phase (red). In contrast, 246 genes were initially up-regulated, but their expression level was down-regulated between early (response) phase and the late (adaptation) phase (green). See text for more details.

