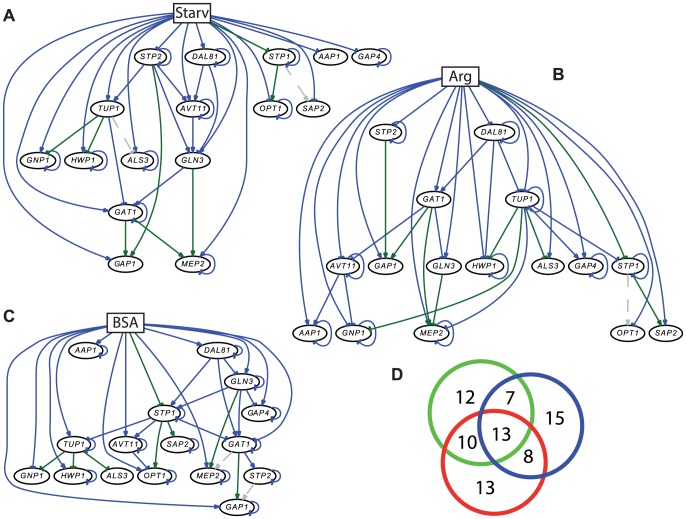
Figure 4. Predicted networks based on transcriptome data and prior knowledge under different conditions.
(A) Nitrogen starvation network; (B) Arginine feeding network; (C) BSA feeding network. Blue lines indicate regulatory connections (edges) predicted by the transcriptional data alone, green lines show predicted connections in accordance with previous knowledge, and gray dotted lines indicate known interactions which were not found by the modeling algorithm with the current transcriptome data. (D) Overlaps in edges between the network. Green, nitrogen starvation; blue, arginine feeding; red, BSA feeding.

