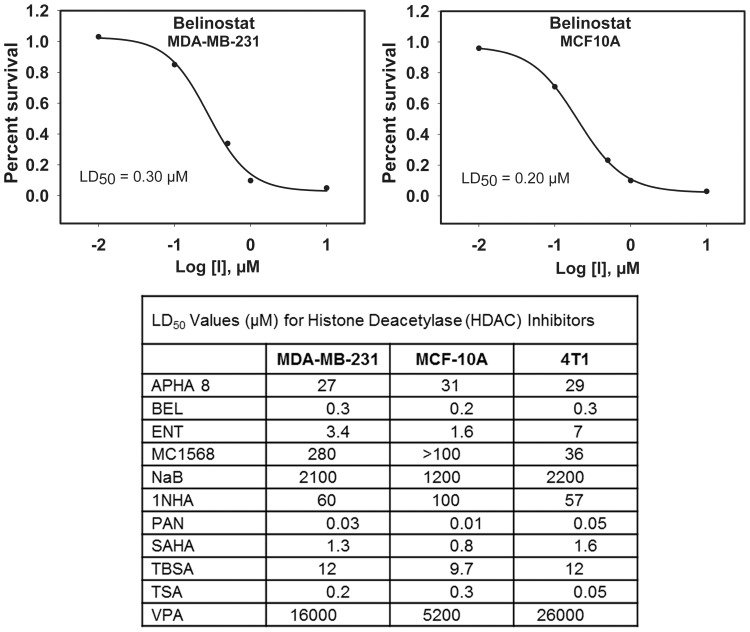
Figure 1. Approximate LD50 values determined for a panel of HDAC inhibitors in breast cancer cells.
Proliferating breast cancer (MDA-MB-231), murine mammary carcinoma (4T1) and normal breast epithelial (MCF10A) cells were treated with a panel of histone deacetylase inhibitors at a range of concentrations, and cell viability was assessed after three days. Shown are representative dose-response curves for MDA-MB-231 and MCF10A cells treated with belinostat (upper panels) and a table of approximate LD50 values calculated from dose-response curves for the entire panel of inhibitors.

