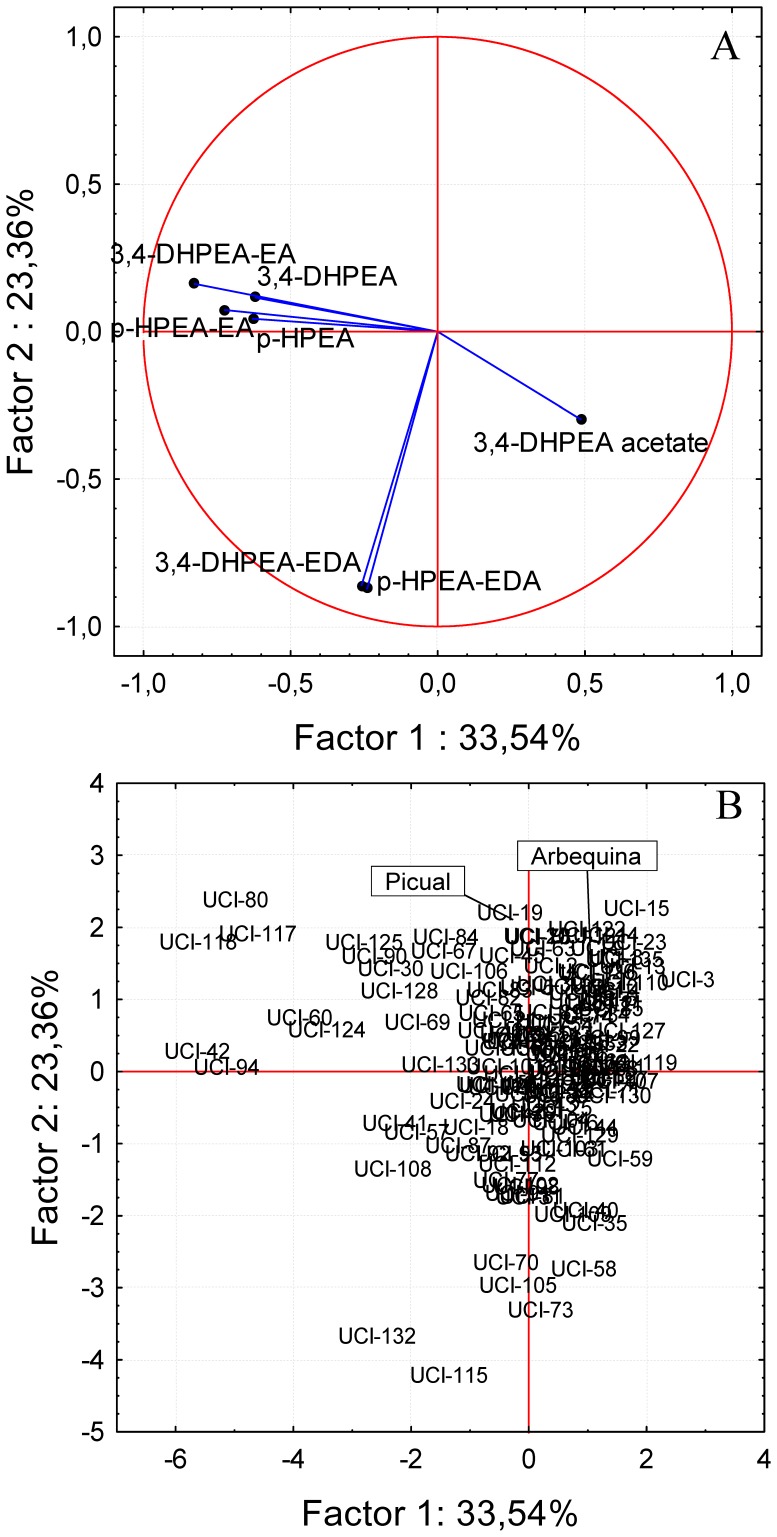
Figure 6. Principal component analysis of the tyrosol and hydroxytyrosol derived phenolic compounds.
Bi-plot of the tyrosol and hydroxytyrosol derived phenolic compounds in the oils from the Picual x Arbequina progeny, including the genitors. Factors 1 and 2 explain 56.90 % of the data variation. A: vector distribution of the tyrosol and hydroxytyrosol derived phenolic compounds, B: distribution of the genotypes from the progeny.

