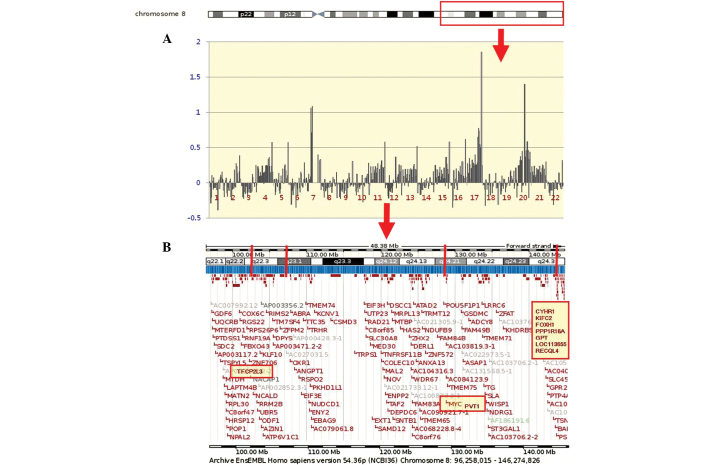
Figure 1.
(A) An example of an individual profile at the 8q22.1-q24.3 region in the 22 GC cases. High-level amplifications are clearly seen in cases 7, 17 and 20. Cytobands in the ideogram are shown in the upper image. (B) The schematic presentation of cytogenetic bands, and a map position from the UCSC genome browser is shown below the plot. The candidate target genes (TFCP2L3, MYC, PVT1, CYHR1, KIFC2, FOXH1, PPP1R16A, GPT, LOC113655 and RECQL4) at the 8q22.1-q24.3 region are shaded in yellow. GC, gastric carcinoma; UCSC, University of California Santa Cruz; TFCP2L3, transcription factor CP2-like 3; MYC, myelocytomatosis; PVT1, plasmacytoma variant translocation 1; CYHR1, cysteine/histidine rich 1; KIFC2, kinesin family member C2; FOXH1, forkhead box H1; PPP1R16A, protein phosphatase 1 regulatory subunit 16A; GPT, glutamic-pyruvate transaminase; RECQl4, RecQ protein-like 4.

